
Spatial Transcriptomics Sequencing
Spatial Transcriptomics Sequencing
The essence of spatial transcriptomics lies in the utilization of spatially barcoded DNA capture probes. This technology addresses the limitation in single - cell sequencing by preserving crucial spatial location information. Through the reconstruction of the original tissue architecture, this methodology offers in - depth perspectives in life sciences and disease research, which has led to its recognition as the "Method of the Year 2020" by Nature Methods.
EPIBIOTEK® presents its newly upgraded High-Sensitivity Spatial Transcriptomics Sequencing Service. Leveraging the CelAtlas microbead array chip, this service exhibits notably improved capture rates. It allows for the in situ capture of whole-transcriptome information, thereby enabling multi-level spatial positioning analysis at the tissue, cellular, and molecular levels. Characterized by a high resolution of 10 μm and excellent sensitivity, this service is well-suited for research in oncology, immunology, neuroscience, and developmental biology.

Workflow
The service employs CelAtlas chips equipped with capture probes that possess specific spatial coordinates. When in contact with a tissue section, these probes conduct in-situ capture of mRNA molecules, followed by the synthesis of cDNA. Via NGS and specialized visualization instruments, the spatial gene expression patterns of the sample are reconstructed.
Applications
1. Multi-Level Profiling: Analyze spatial expression patterns at the tissue, cellular, and molecular levels.
2. Cell Definition: Define cell types and their specific functions within the tissue context.
3. Microenvironment Interactions: Investigate the relationship between cellular gene expression and the tissue microenvironment.
4. Biomedical Research: Applied in oncology, immunology, neuroscience, developmental biology, and disease biomarker discovery.
Advantages
1. Bead Array Technology: Utilizes microbead arrays as the chip carrier with tightly packed beads to achieve higher probe density.
2. High Resolution: Achieves a spatial resolution of 10 μm.
3. High Sensitivity: High detection rate for low-abundance genes, resulting in more precise expression profiling.
Sample Requirements
Type
OCT-embedded frozen tissue blocks
Species
Human, Mouse, Rat
Bioinformatic Analysis
Basic Analysis
1. Data Pre-processing & QC:
a. Data distribution analysis.
b. Statistics on Gene counts, Total UMI, Mitochondrial gene ratio, and Ribosomal gene ratio.
c. Top 20 expressed genes.
2. Cell Clustering:
a. Spatial mapping of cell types.
b. Cell type mapping on UMAP.
c. Cell type mapping on tSNE.
d. Cell cycle mapping on UMAP.
3. Automated Cell Annotation (Spatial, UMAP, tSNE plots).
Advanced Analysis
1. Functional Enrichment: Enrichment analysis of marker genes.
2. Trajectory Analysis:
a. Pseudotime UMAP mapping.
b. Trajectory clustering UMAP mapping.
c. Pseudotime differential gene expression.
d. Cluster pseudotime differential gene expression.
3. Cell-Cell Interaction Analysis:
a. Interaction strength and weights.
b. Number of interactions.
4. Spatially Variable Genes: Identification of genes with spatially specific expression patterns.
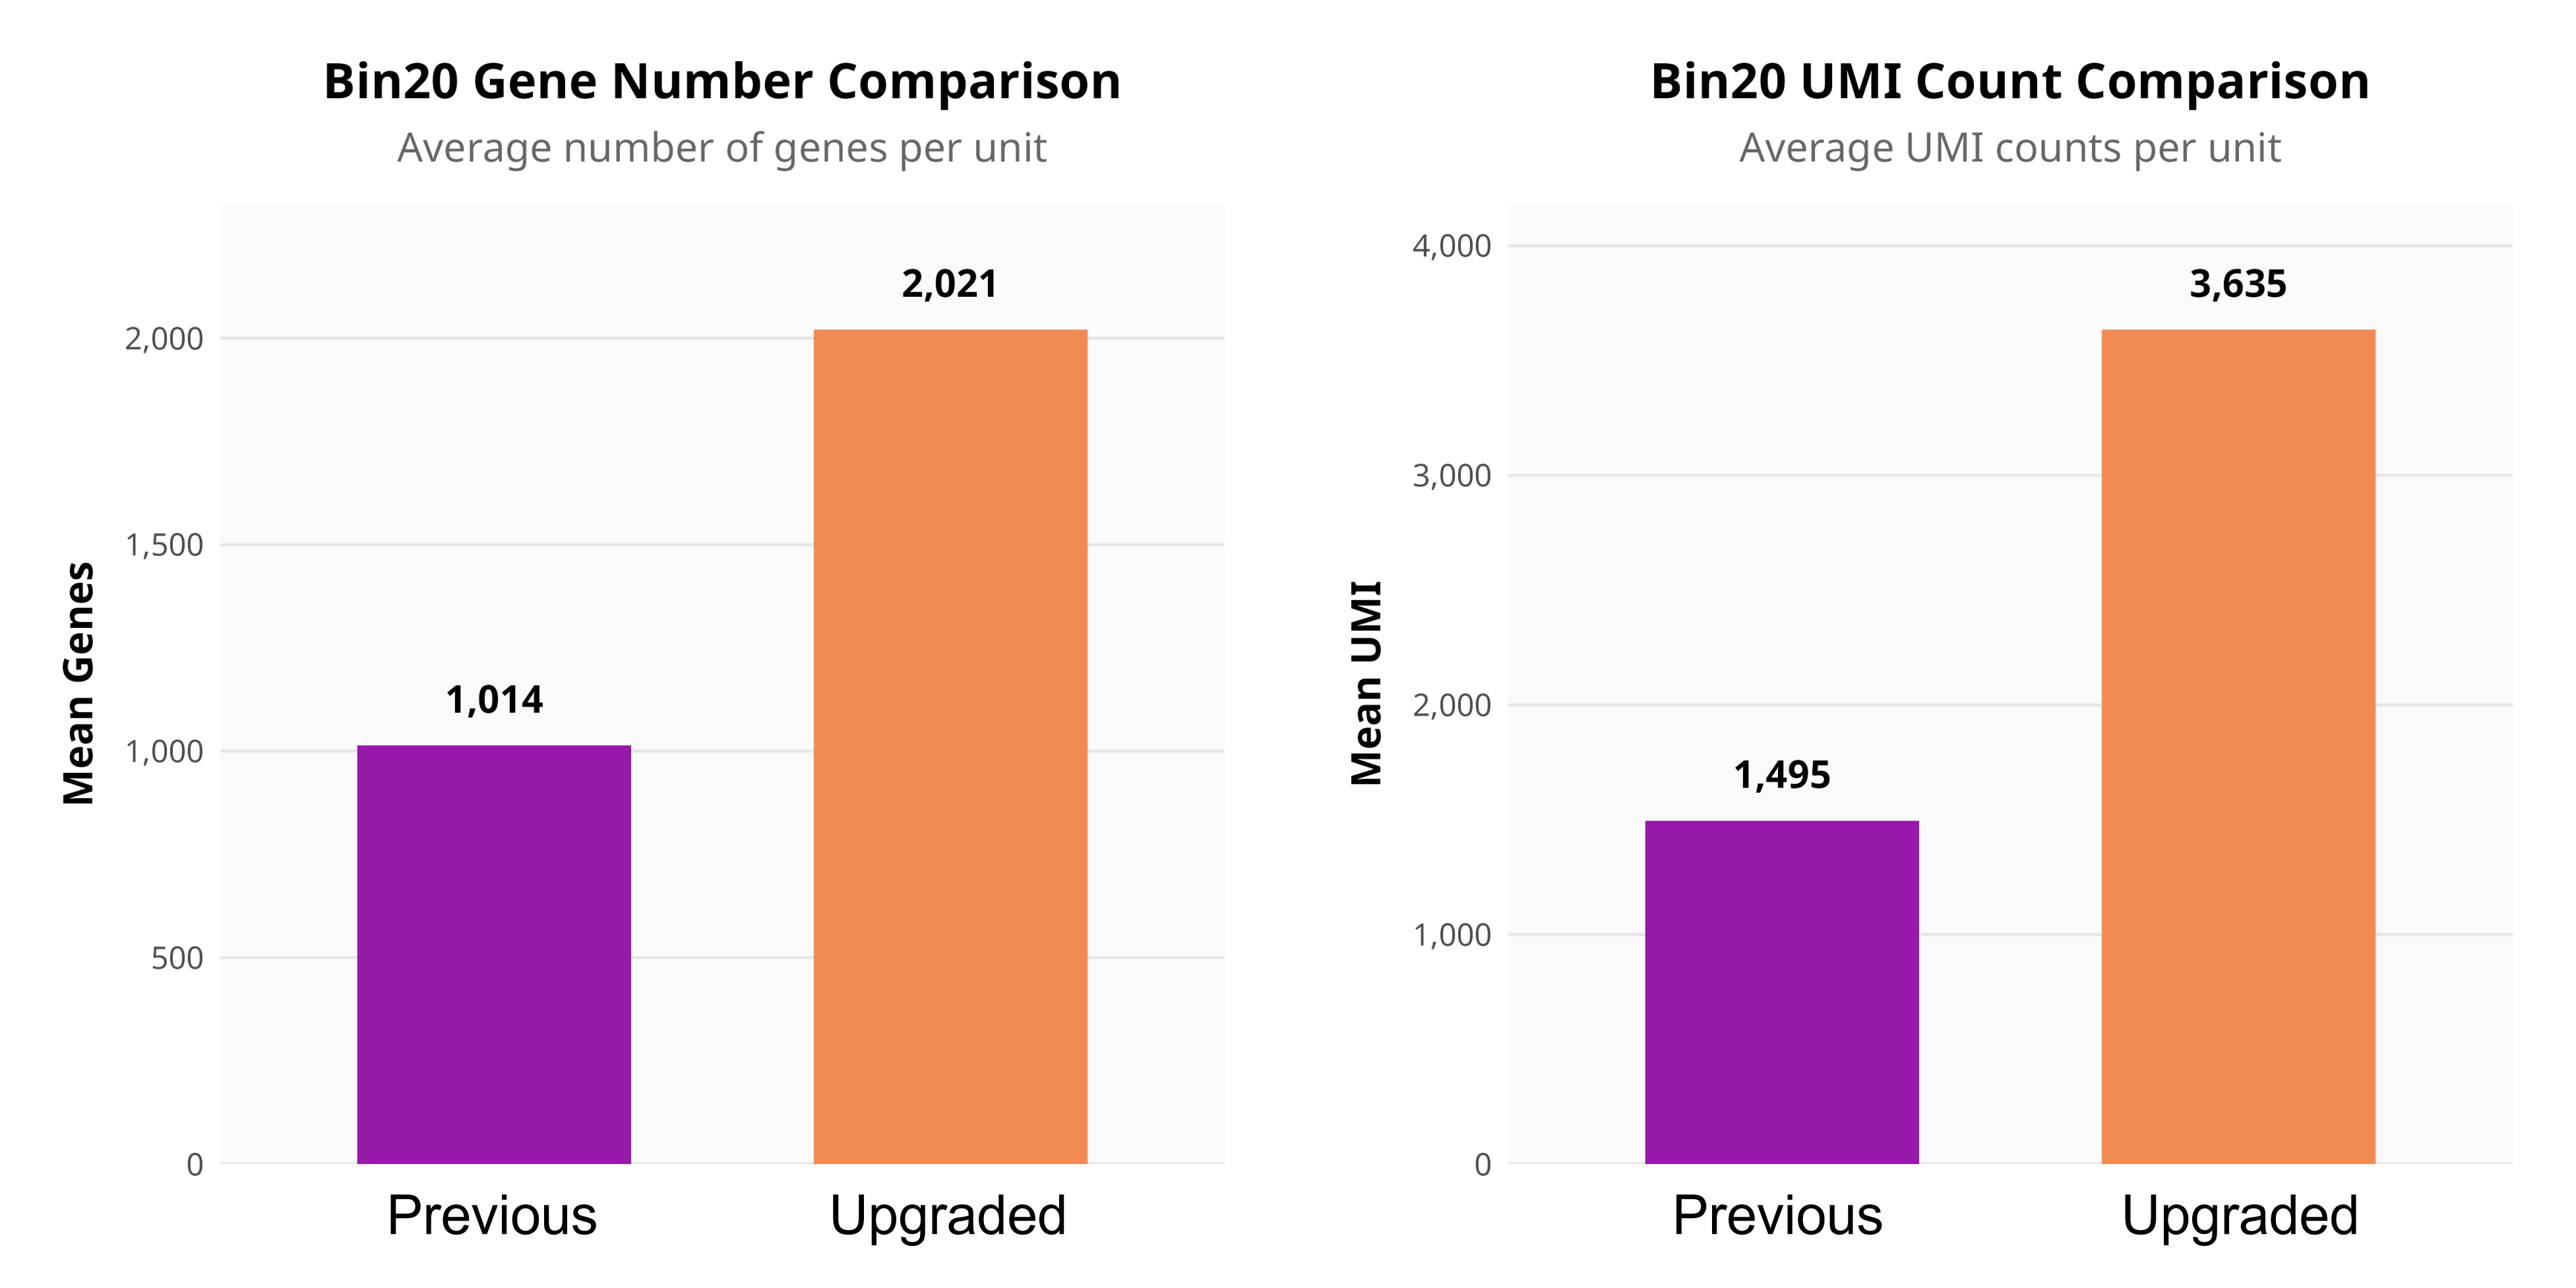
Upgraded spatial transcriptomics chip demonstrating significantly improved capture rates.
Demo
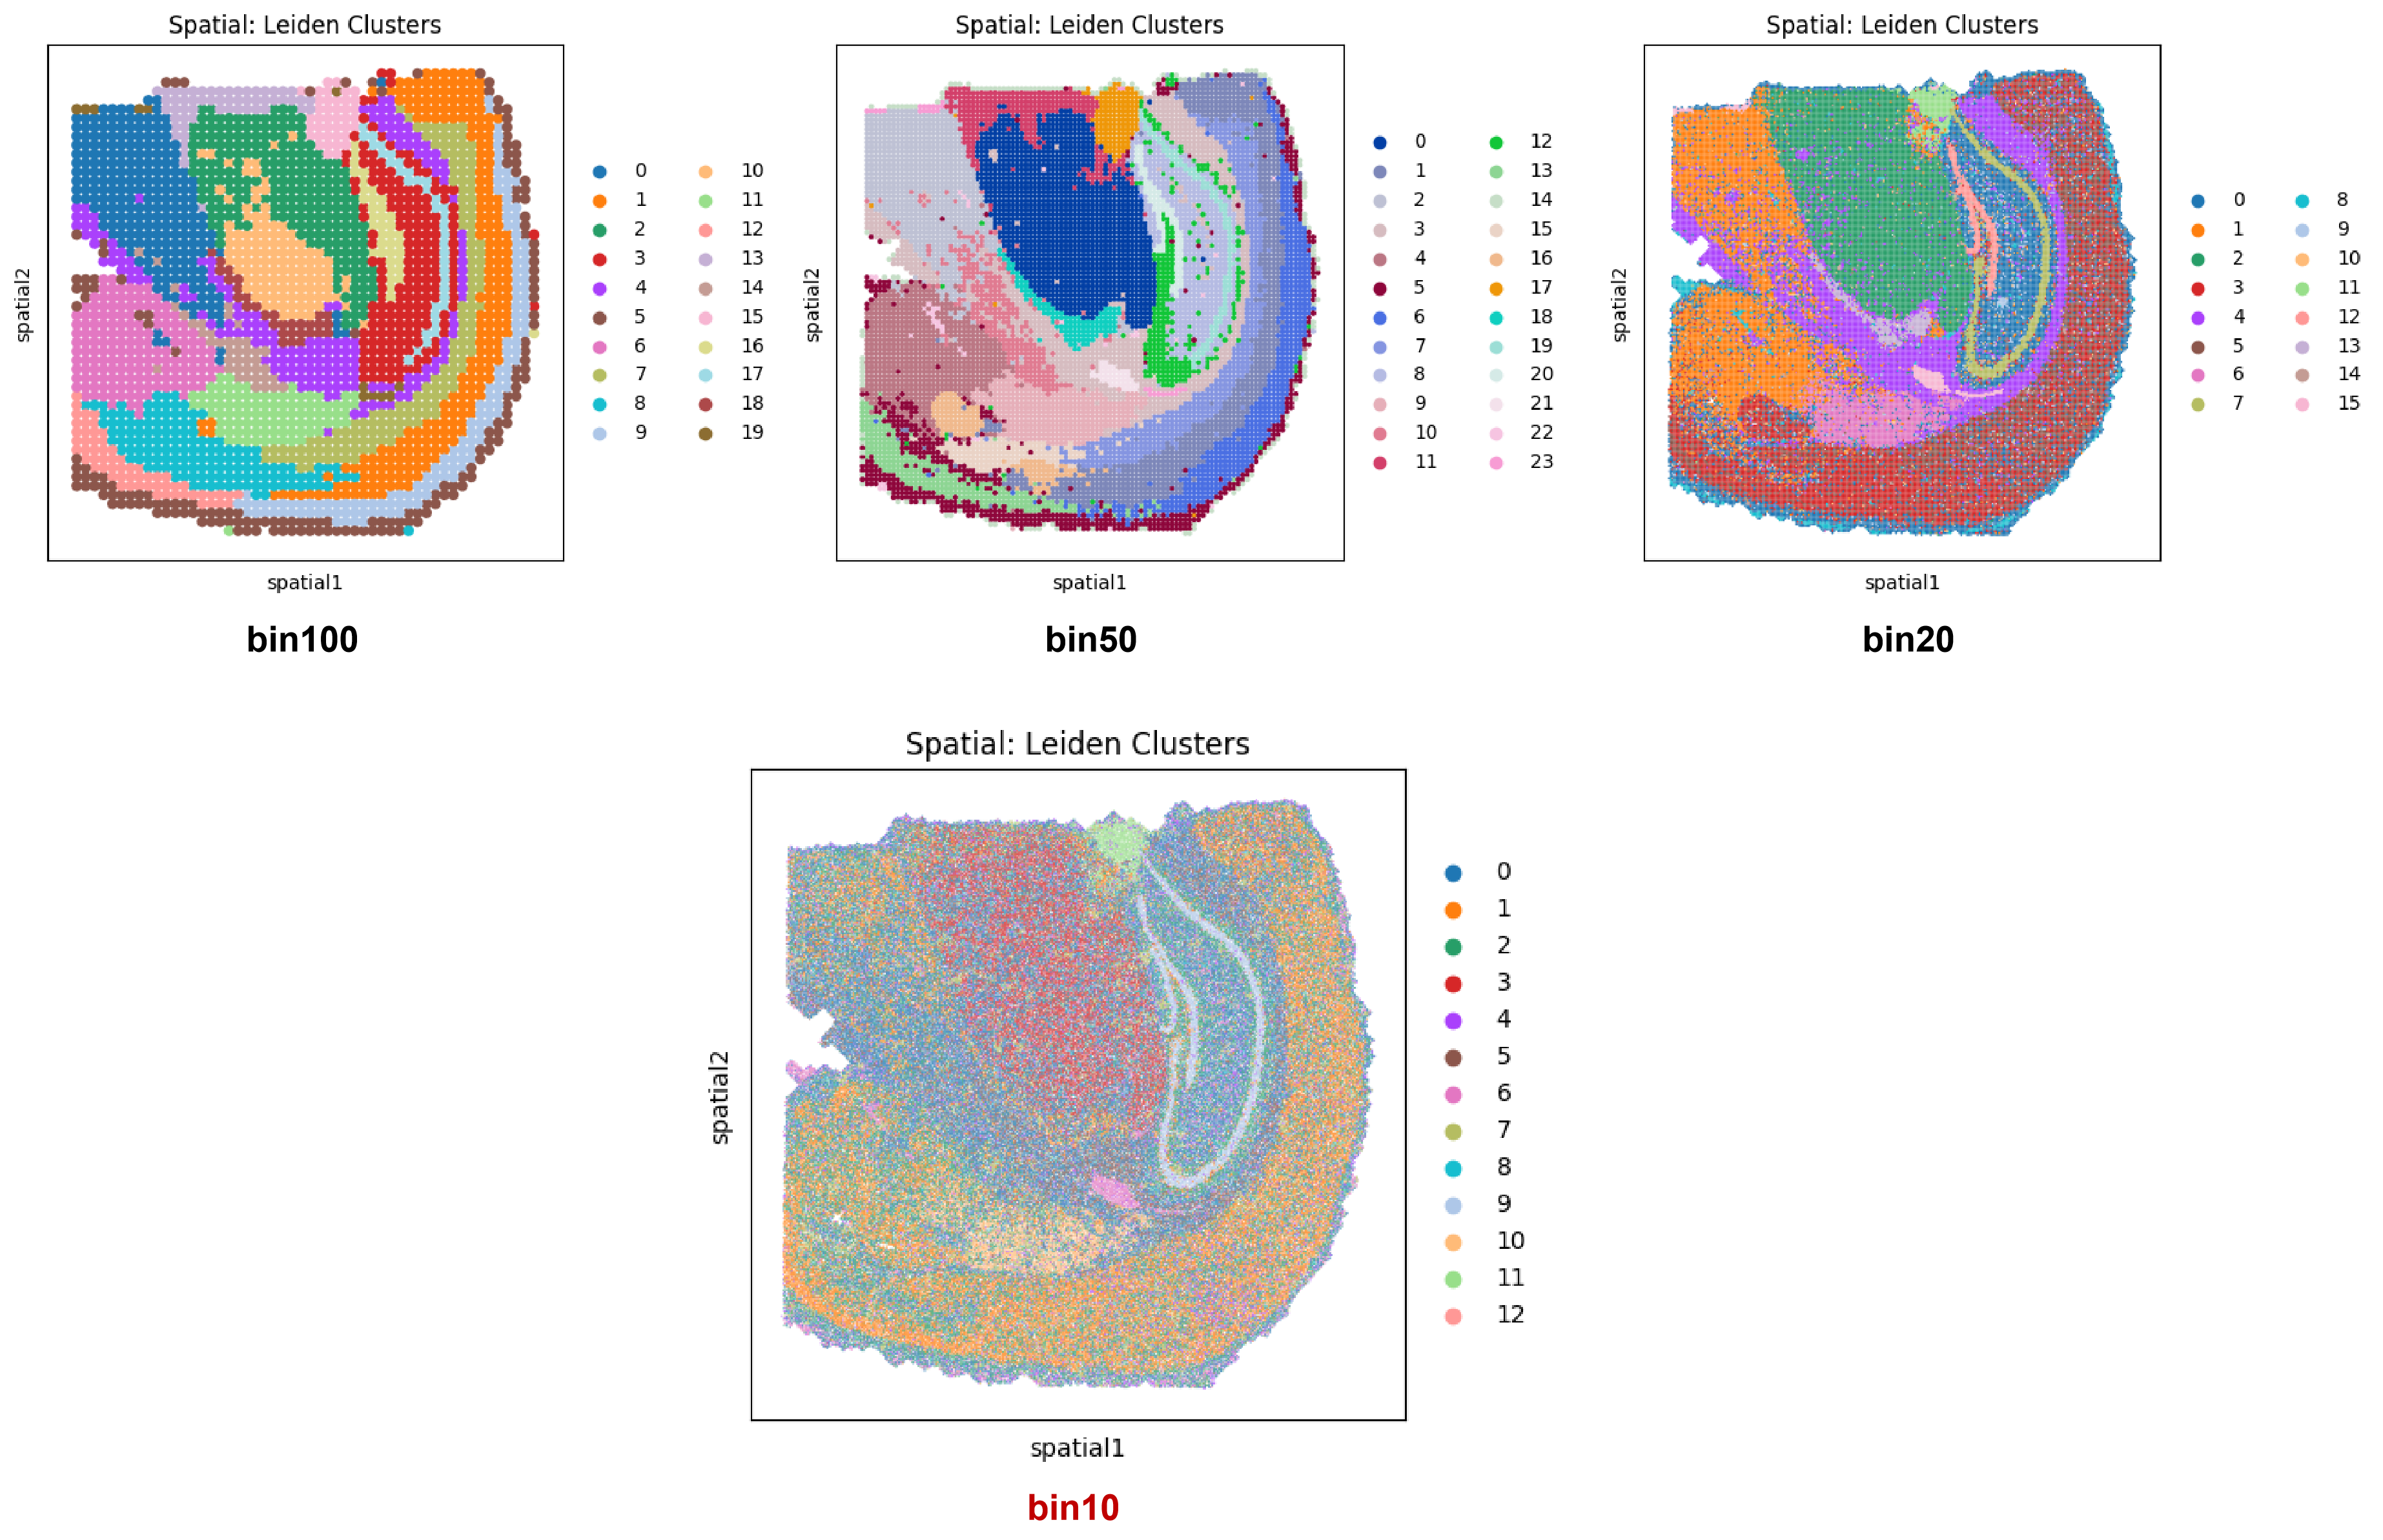
Spatial mapping comparison: 10 μm (Bottom) vs. 100 μm, 50 μm, and 20 μm resolutions.
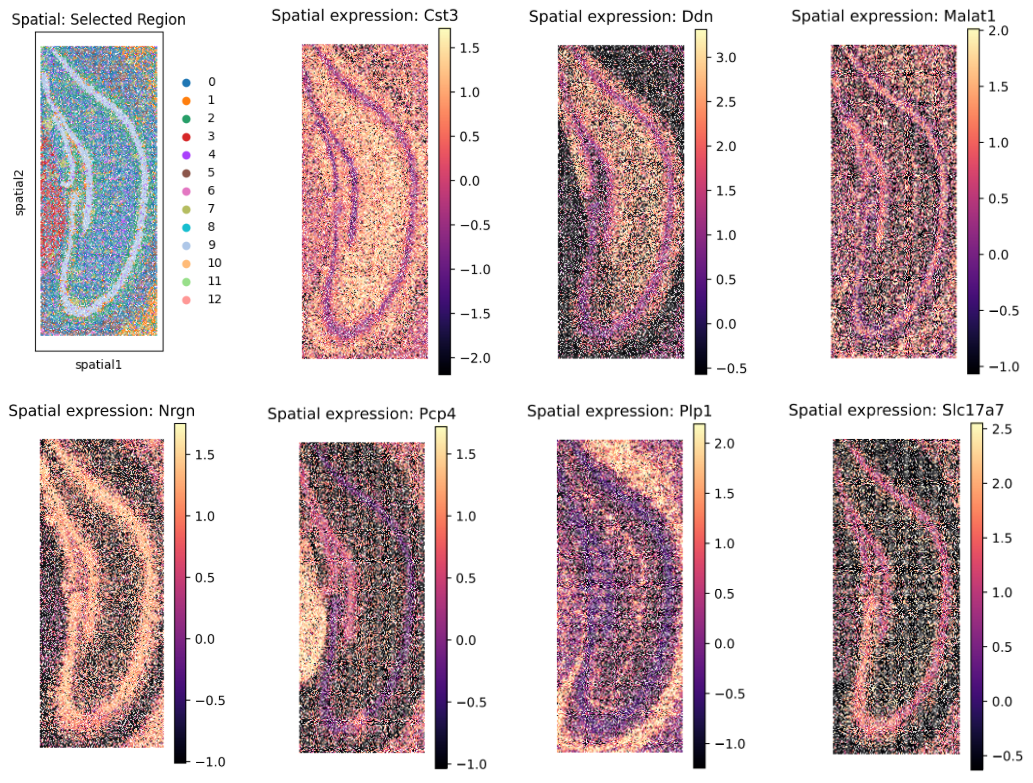
Detailed spatial mapping of a selected region at 10 μm resolution.
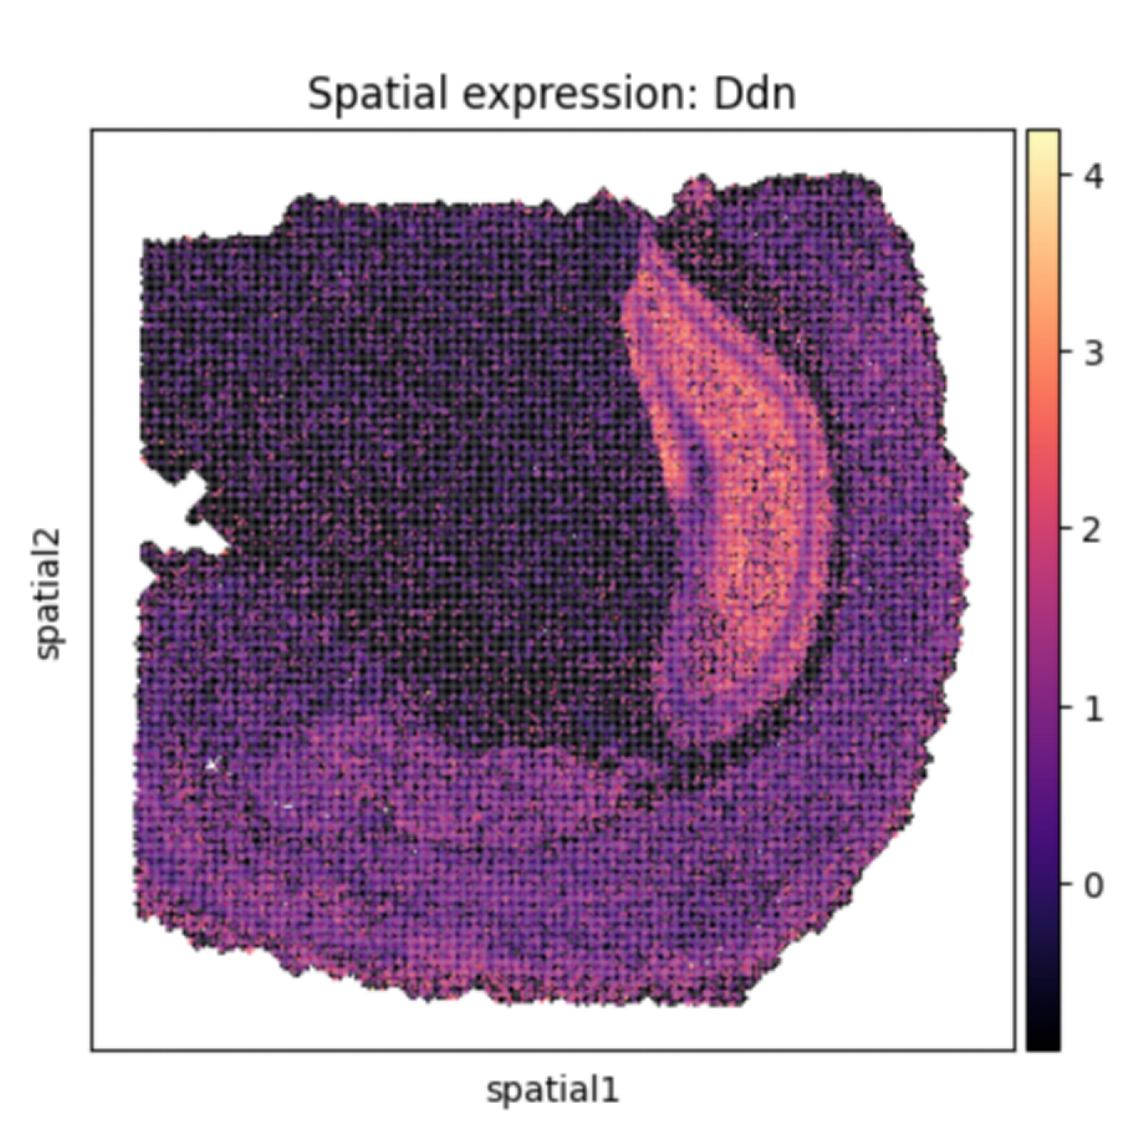
Heatmap of spatially specific expressed genes.
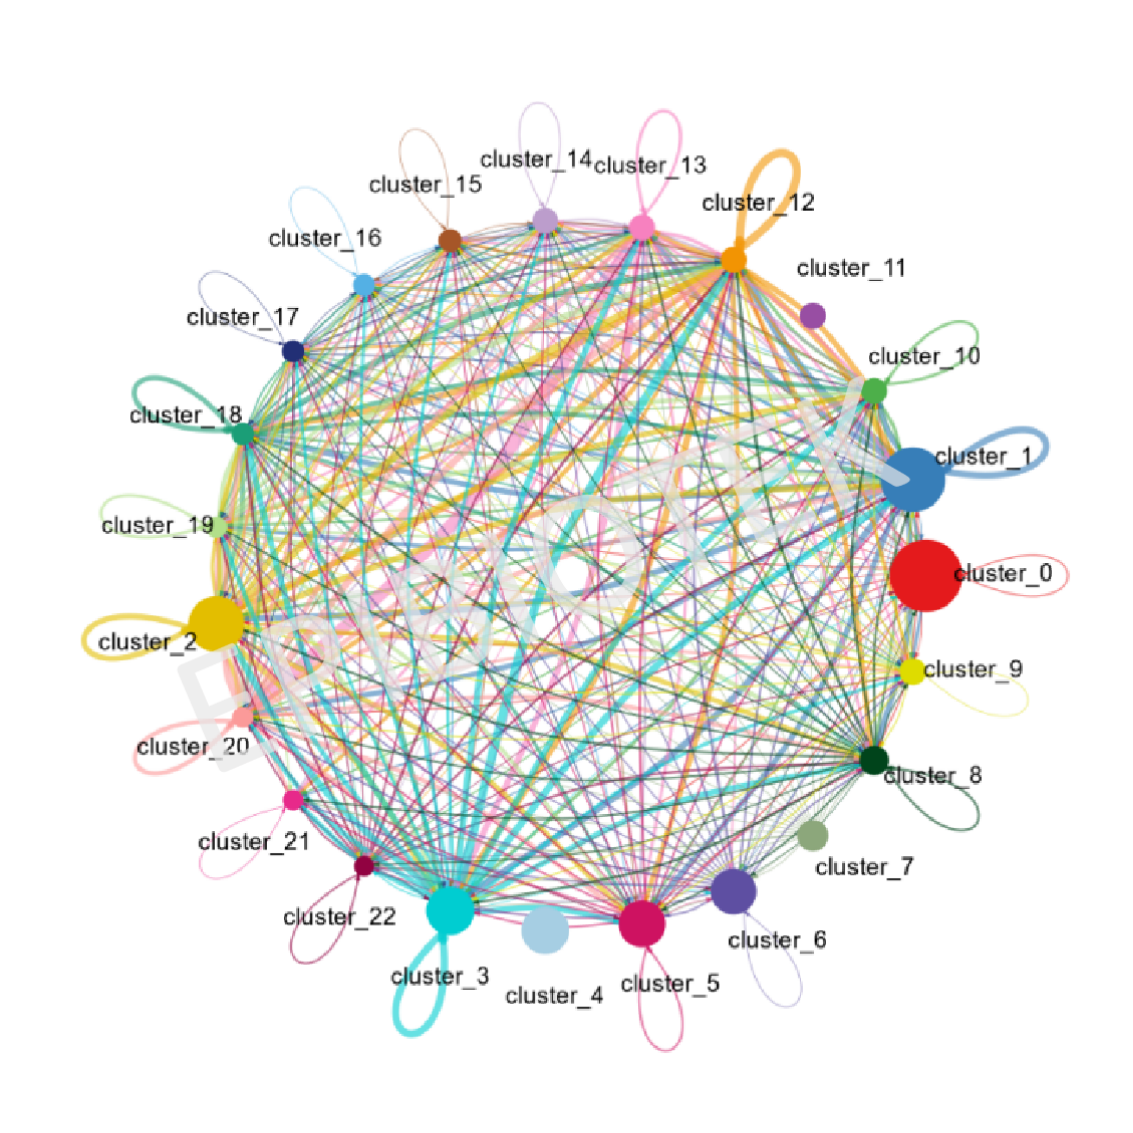
Number of cell-cell interactions.