
Active Ribo-seq
Introduction
Active Ribo-seq
Conventional Ribo-seq technology can detect the distribution of ribosomes on transcripts and translational activity, serving as a classic research tool to elucidate the mechanisms of translation. However, it cannot distinguish between active and inactive ribosomes during translation. To address the increasing demands of the biomedical field for translatome sequencing technology, EPIBIOTEK® has taken the lead in China to introduce the RiboLace technology from IMMAGINA Biotechnology and launched the Active Ribo-seq service. This technology is based on the separation of active ribosomes using biotin-modified puromycin (3P complex) and does not require antibodies and labels. It uses over 90% less sample volume than traditional Ribo-seq, enabling the rapid and efficient mapping of active ribosome profiles across the whole transcriptome with single-nucleotide resolution.
Applications (Joint long RNA-seq)
1. To detect the distribution and translational activity of active ribosomes on transcripts.
2. Predict the starting site of translation and ORF location.
3. Calculate protein translation efficiency.
4. Explore the regulation and gene expression.
5. Identification of new proteins/short peptides.
Advantages
1. Identify RNA molecules in the translation transition and accurately map the ribosome during translation.
2. The sample size requirement is lower, which can be as low as the single cell level.
3. Highly accurate active ribosome maps with single base resolution.
Sample Requirements
Types & Amount
1. Cells, ≥ 1×10⁶ cells/sample
2. Tissues, ≥ 50 mg/sample
Species
Limited to human, mouse, and rat; for lower sample volumes and other species, please inquire for assessment.
Sample grouping
1. At least 2 groups of samples are required, including a control group and an experimental group (clinical samples are normal group and patient group)
2. Each sample was subjected to Ribo-seq and longRNA-seq
3. Sample size suggestion: 3 VS 3
Bioinformatic Analysis
Basic Analysis (Active Ribo-seq)
1. Genome-wide translational activity analysis
2. Calculation of gene translation efficiency
3. Analysis of genes with differential translation efficiency
4. GO analysis of genes with differential translation efficiency
5. KEGG analysis of genes with differential translation efficiency
6. Prediction of start codons (e.g. non-ATG starts)
7. Prediction of ORF positions
8. Identification of novel proteins/novel peptides
9. Differential analysis of codon usage frequency
10. Prediction of coding capacity for lncRNA/circRNA
Control Analysis (long RNA-seq)
1. Data quality control
2. Gene alignment and statistics
3. Differential expression analysis of mRNA
4. Differential expression analysis of lncRNA
5. GO analysis of differentially expressed genes
6. KEGG analysis of differentially expressed genes
7. Differential expression analysis of circRNA
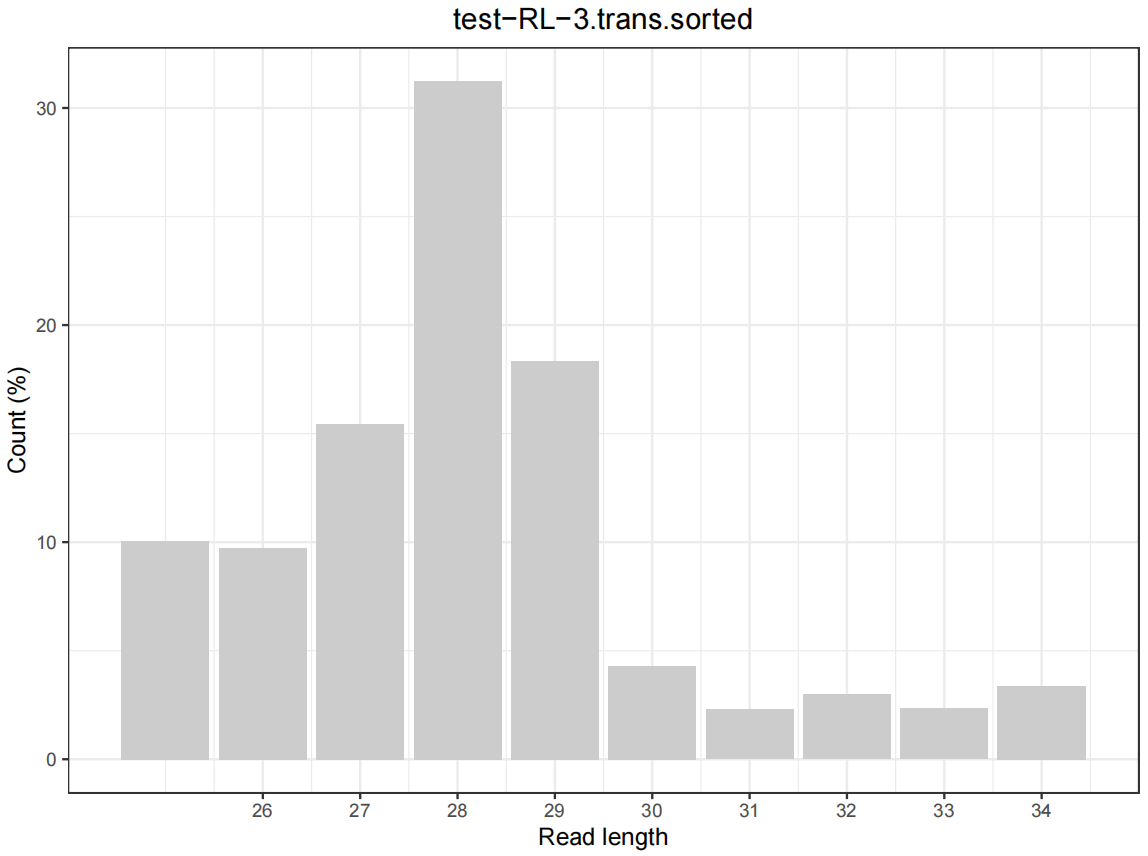
Figure 1. Length distribution of reads aligned to the genome
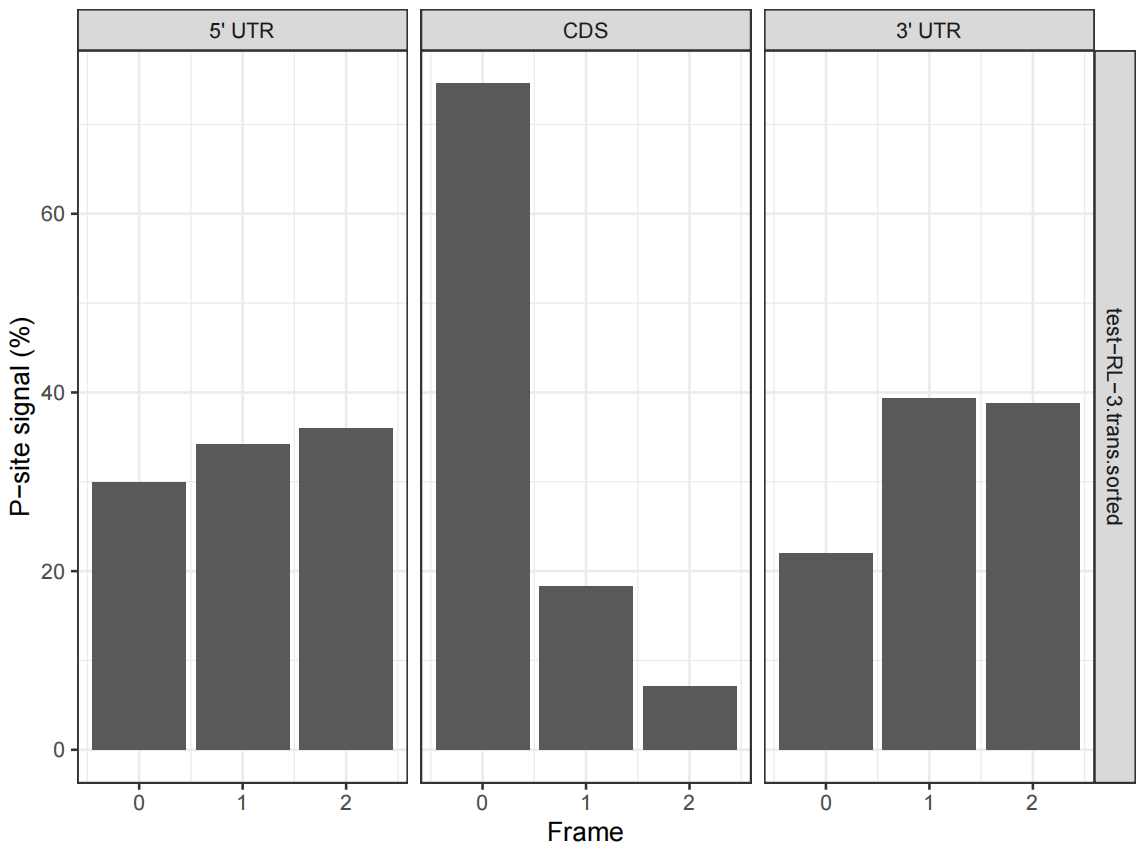
Figure 2. Distribution of P-site signals in 5 'UTR, CDS and 3' UTR
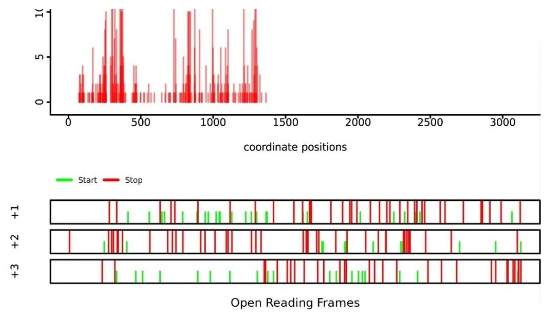
Figure 3. RiboLace shows a typical periodic 3-nt distribution
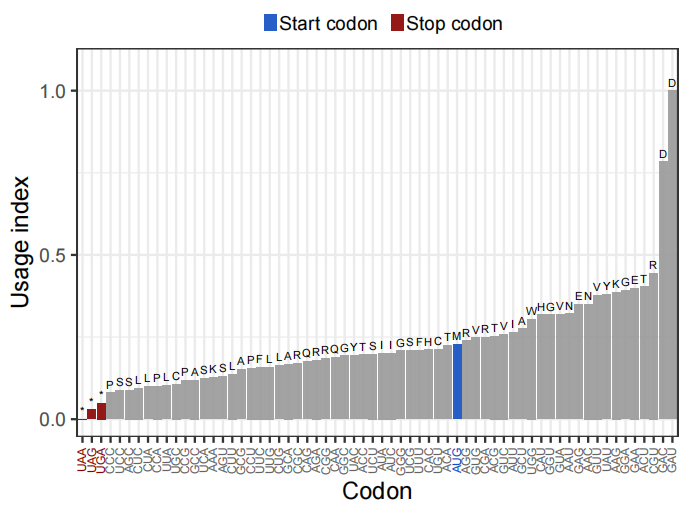
Figure 4. Analysis of different codon usage frequencies