
Single-cell ATAC-seq
scATAC-seq
Since its introduction, ATAC-seq has rapidly become a powerful tool for studying chromatin accessibility, owing to its convenient workflow, low cell input requirements, and high signal-to-noise ratio. Its application value spans multiple areas, including identification of gene regulatory elements, investigation of transcription factor binding, and discovery of potential biomarkers. It has been widely applied across diverse research fields such as gene regulation, cell development and differentiation, disease research, and three-dimensional genome architecture, driving numerous significant research advances.
To meet higher-level research demands and enable more refined chromatin accessibility studies at the single-cell level, EPIBIOTEK® has officially launched scATAC-seq, a single-cell epigenomics product based on the MGI platform. Through highly efficient capture beads and library preparation kits, this solution maximizes the stability and reproducibility of scATAC library construction, delivering superior data at lower cost. Key features include cell capture efficiency exceeding 60%, doublet contamination rate below 6% when capturing 15,000 nuclei, and a short turnaround time with library preparation completable within one day. Through scATAC-seq, dynamic changes in chromatin accessibility states within heterogeneous cell populations can be monitored. High-precision cell state identification is critical for generating developmental trajectories, characterizing cell differentiation, and defining disease-related cellular state transitions, providing deeper insights into gene regulation.
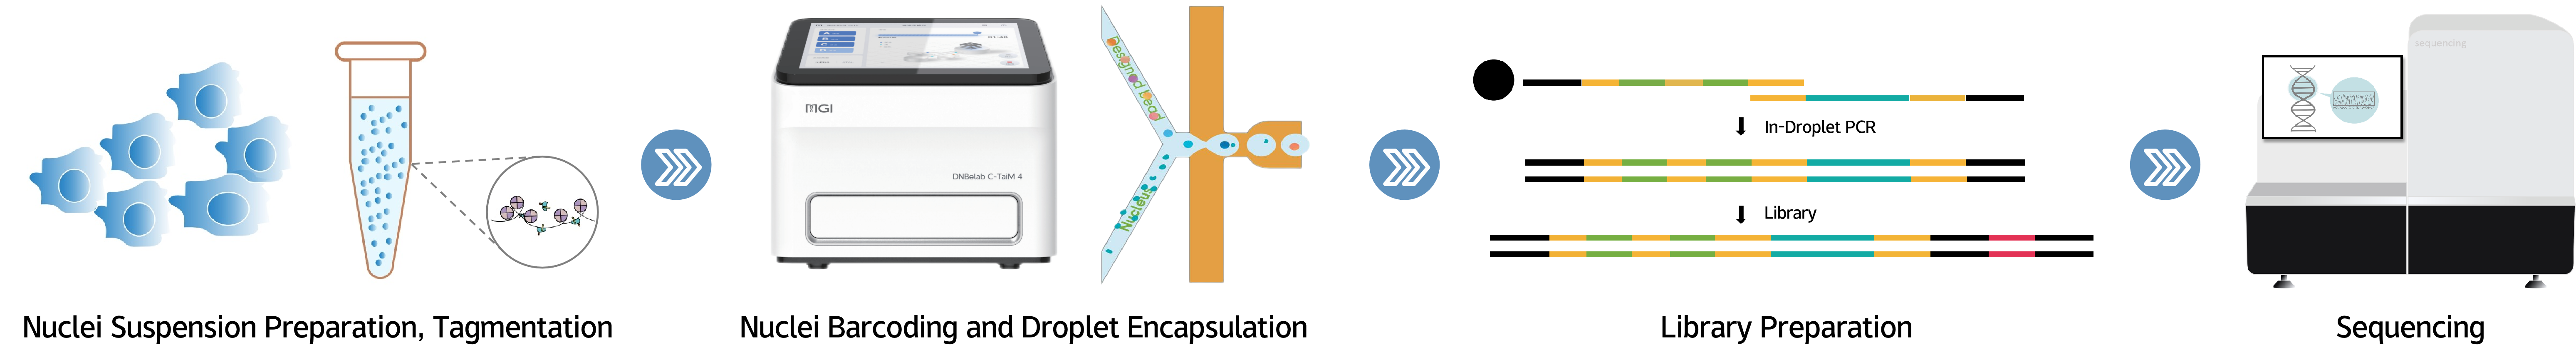
Workflow
1.Prepare nuclei suspension from cells or tissues, add Tn5 transposase for bulk tagmentation
2.Nuclei barcoding and sorting to generate droplets (DNBelab C4 features 4 independently controlled microfluidic channels, supporting flexible loading of 1–4 samples. Nuclei isolation and barcoding during scATAC library preparation takes only 6 minutes)
3.Recover droplets for PCR, break emulsion to recover DNA, and construct single-cell ATAC libraries
4.Pool libraries for high-throughput sequencing
Advantages
Advantages over Conventional ATAC-seq:
1. Single-cell resolution to identify chromatin accessibility features of individual cells, detect rare cell types, and understand unique regulatory characteristics
2. Characterize regulatory elements specific to cell types or lineages
3. Provide higher accuracy when generating developmental trajectories, profiling cell differentiation, and characterizing disease-related cellular state changes
4. Enable detection of rare chromatin accessibility changes in small cell populations or transitional states
5. Allow high-accuracy tracking of dynamic changes
Applications
1. Analyze chromatin accessibility in heterogeneous cell populations to identify cell types and subtypes, revealing gene regulatory mechanisms and cell differentiation processes
2. Monitor dynamic changes in chromatin accessibility. For example, track dynamic changes across different developmental stages to understand how cells alter gene expression over time
3. Identify open chromatin regions through peak calling and cell clustering analysis, infer gene expression potential, and link regulatory elements to target genes
4. Integrate with scRNA-seq data to correlate chromatin accessibility with gene expression patterns, enabling discovery of whether differentially expressed genes also exhibit significant chromatin accessibility differences, thereby revealing regulatory mechanisms underlying cellular function
Sample Requirements
Cells
Cell quantity ≥2×10⁵, viability >85%, cell size 5–40 μm, cell aggregation rate <10%, cell suspension free of visible debris or other contaminants
Tissue
≥0.1 g/sample
Bioinformatic Analysis
Basic Analysis
1. Raw reads filtering and alignment
2. Quality control: insert size distribution, number of fragments in peaks, etc.
3. TSS enrichment score
4. Low-quality cell filtering
5. Dimensionality reduction and clustering analysis
6. Cell type annotation
Advanced Analysis
1. Motif analysis
2. Trajectory analysis
3. Gene enrichment analysis (GO/KEGG) for differential peaks between cell types
Custom Analysis
1.Differential chromatin accessibility region analysis between groups
2.Other customized analyses
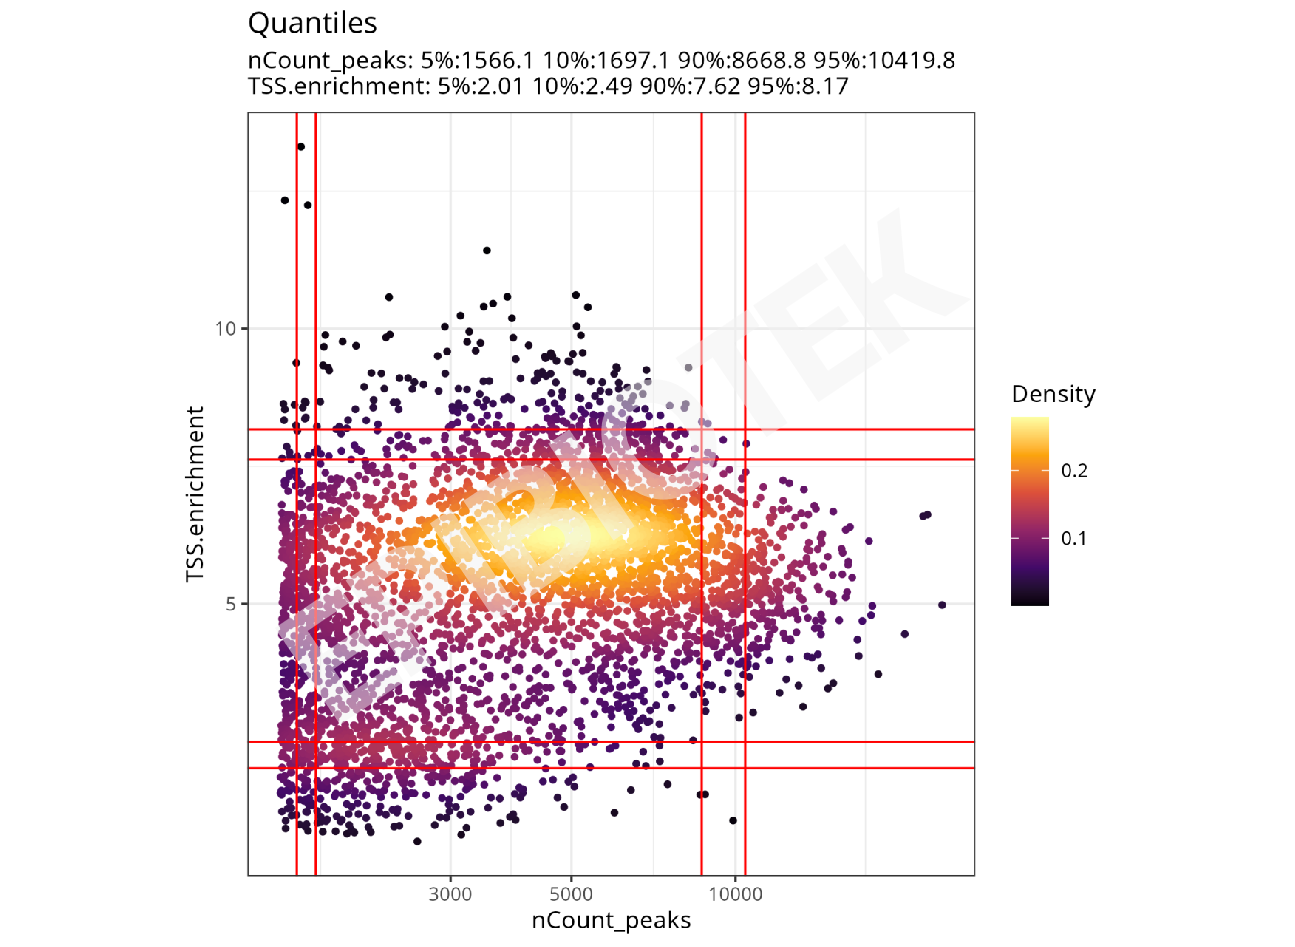
TSS Enrichment Score Density Plot
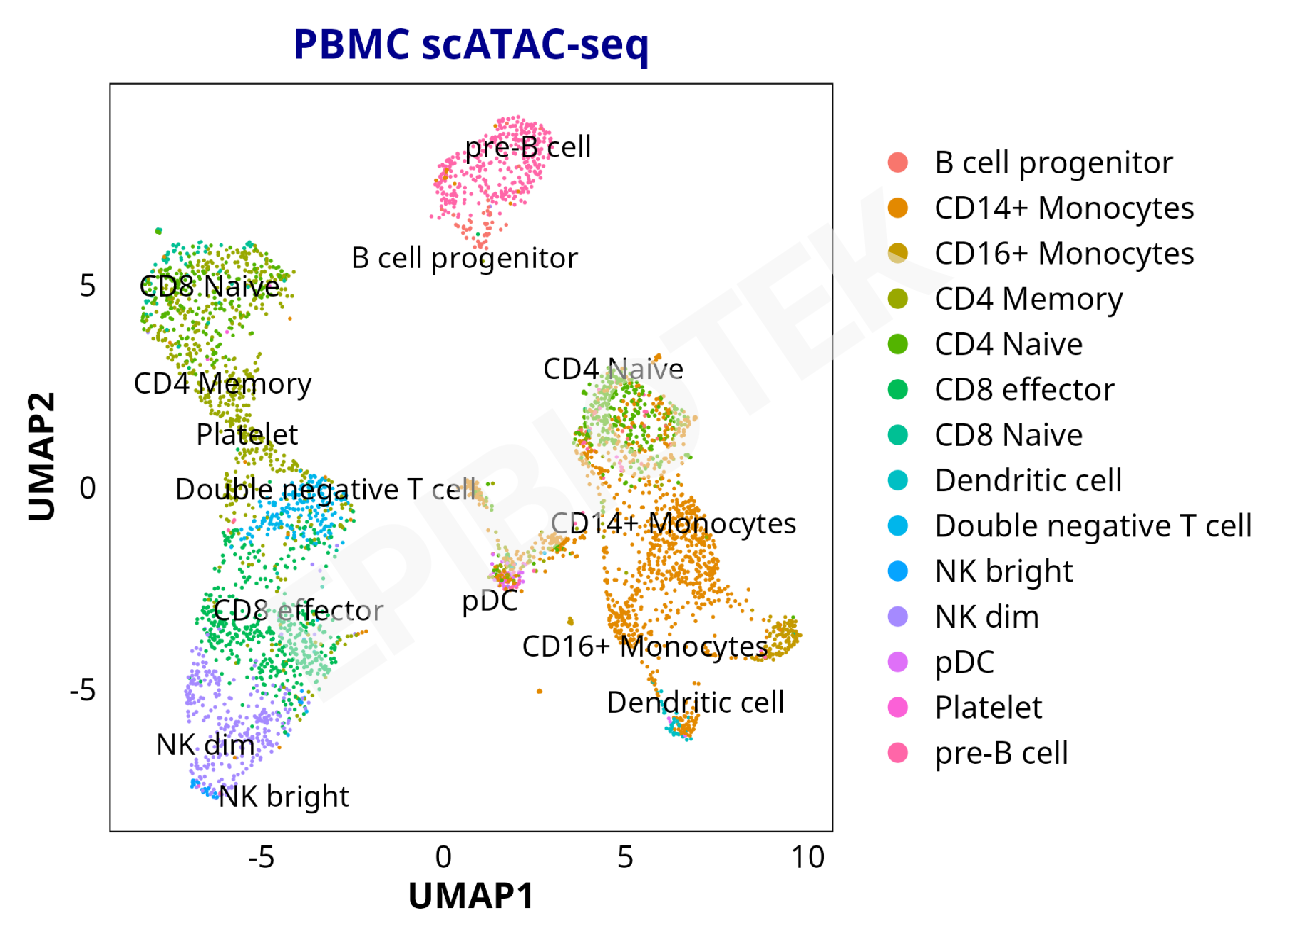
Cell Type Annotation
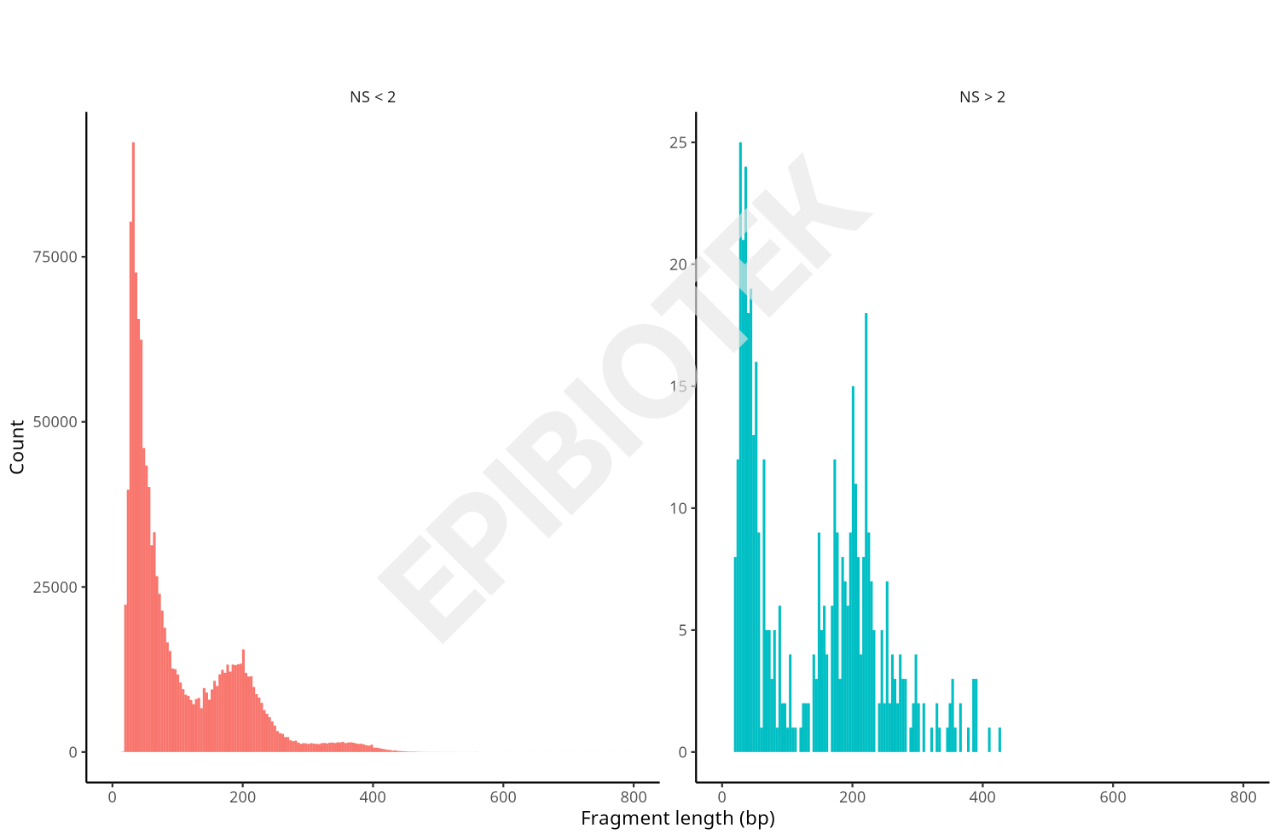
Insert Size Distribution
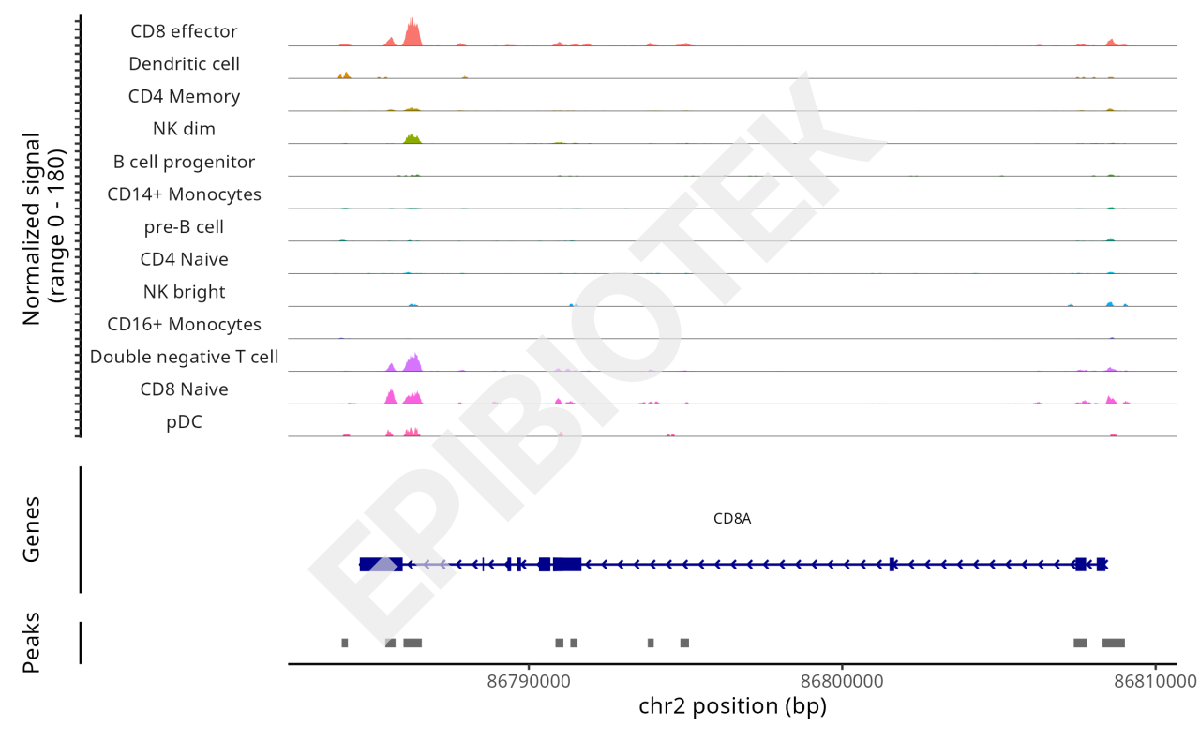
IGV Peak Tracks
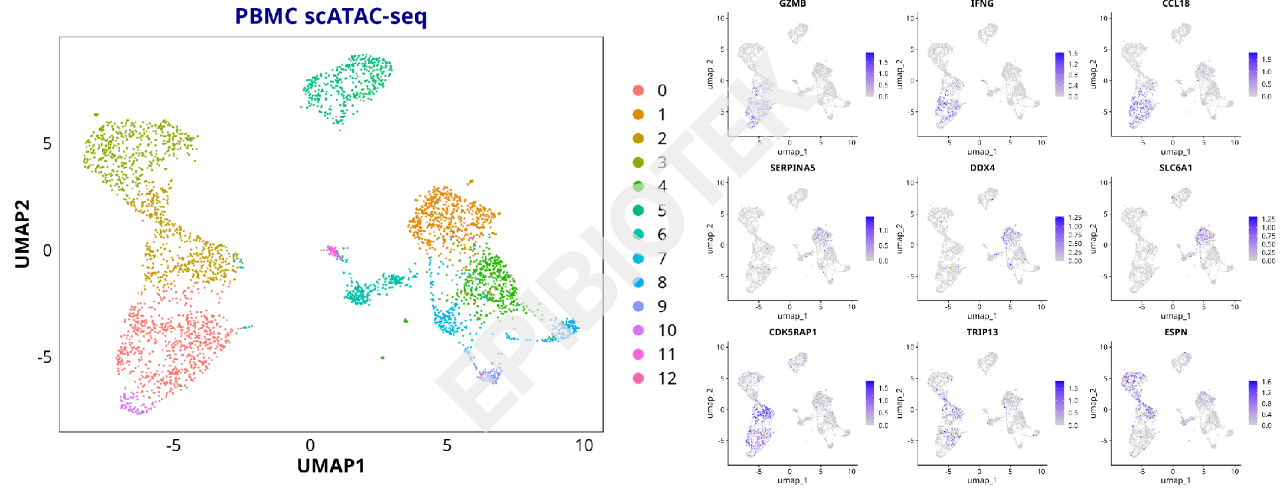
Clustering UMAP Plot
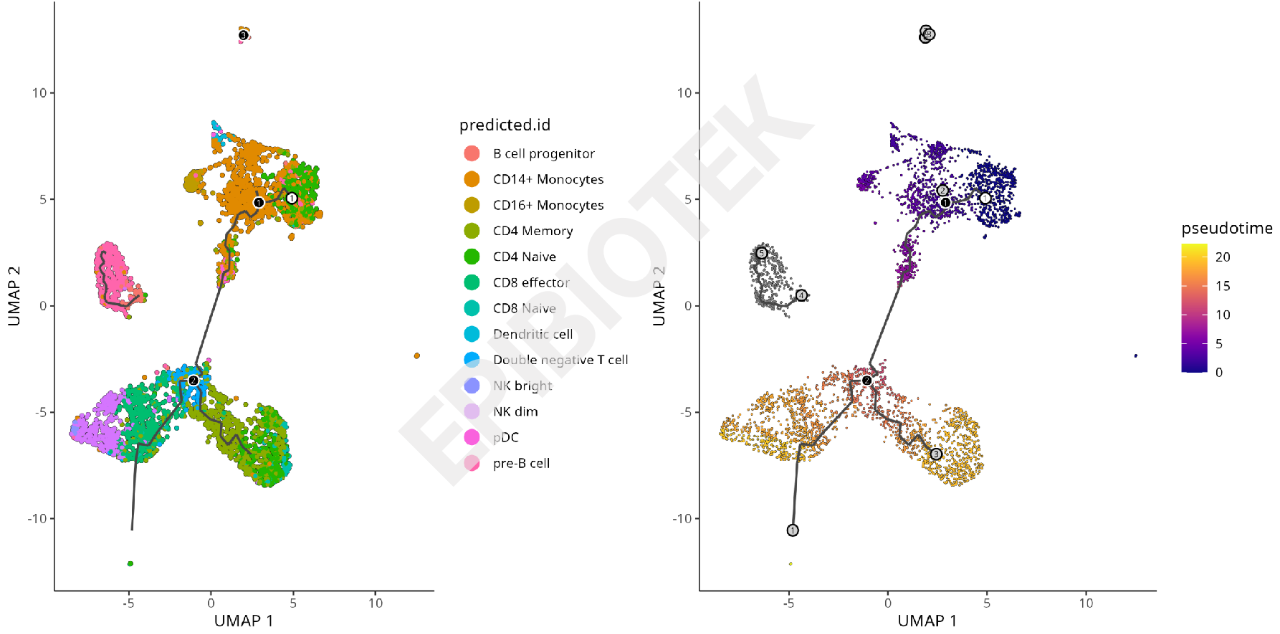
Trajectory Analysis UMAP Plot