
CUT&RUN
CUT&RUN
Cleavage Under Targets and Release Using Nuclease (CUT&RUN) is an innovative technique for detecting protein-DNA complexes within their native chromatin environment. Unlike traditional ChIP-seq, this method eliminates the need for formaldehyde crosslinking and chromatin immunoprecipitation. Consequently, CUT&RUN offers a rapid workflow, requires significantly lower cell input, and delivers superior data with high signal-to-noise ratios and excellent reproducibility. It is also highly effective for single-cell level studies. CUT&RUN represents a revolutionary advancement for research in epigenetics and gene regulation.
Workflow
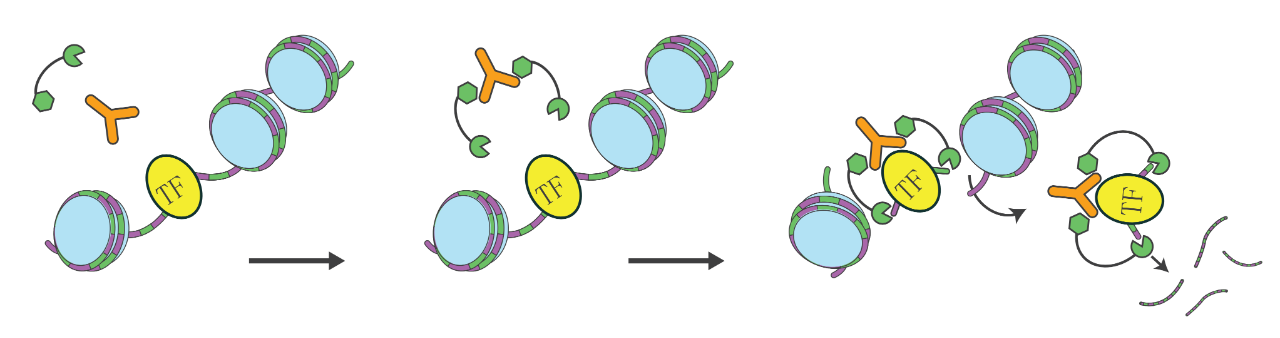
The CUT&RUN protocol bypasses the crosslinking and immunoprecipitation steps required by ChIP-seq. It utilizes a specific antibody against the target protein (e.g., transcription factors or chromatin remodeling proteins) to recruit a Protein A/G-Micrococcal Nuclease (pAG-MNase) fusion protein. The pAG-MNase specifically binds to the antibody and cleaves the DNA flanking the target protein, releasing the specific DNA-protein complex into the supernatant. This released DNA is then harvested for library preparation and high-throughput sequencing.
Advantages
1. Low Input Requirement: Optimized for samples with limited cell numbers.
2. High Signal-to-Noise Ratio: significantly reduced background noise compared to ChIP-seq.
3. High Reproducibility: Consistent results across biological replicates.
4. Streamlined Workflow: Simple operation with a rapid turnaround time (protocol can be completed in 1 day).
Applications
1. Genome-Wide Binding Profiling: Identify genomic binding sites of specific proteins.
2. Regulatory Element Analysis: Characterize protein enrichment at promoters and enhancers.
3. Chromatin State Analysis: Detect genomic accessibility, transcription factor binding sites, and identify super-enhancers.
4. Chromatin Architecture: Map the occupancy of nucleosomes, RNA Polymerase II, and other chromatin-associated proteins.
Sample Requirements
Type
Live cells
Input
5×10⁵ cells/sample
Species
Human, Mouse, and Rat
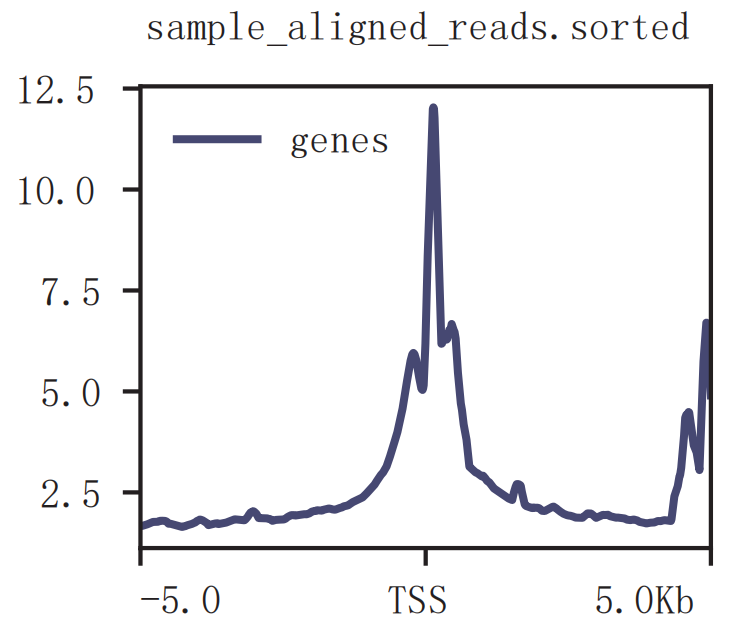
Distribution of reads around TSS
Bioinformatics Analysis
1. Genome Alignment: Mapping reads to the reference genome.
2. Enrichment Analysis:
a. Basic statistics of enriched regions (Peaks).
b. Distribution characteristics of enriched regions.
c. GO (Gene Ontology) analysis of Peak-associated genes.
d. KEGG pathway analysis of Peak-associated genes.
e. Functional enrichment analysis of differentially enriched Peaks.
3. Motif Analysis: Identification of consensus sequences within enriched regions.
4. Super-Enhancer Analysis: (Applicable for H3K27ac, BRD4 antibodies, etc.).
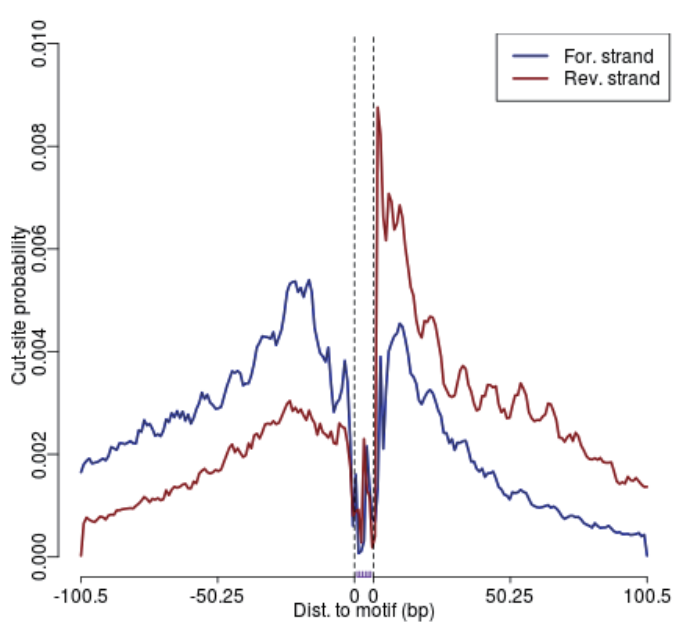
Footprinting Analysis: Visualization of cleavage frequency at motif sites
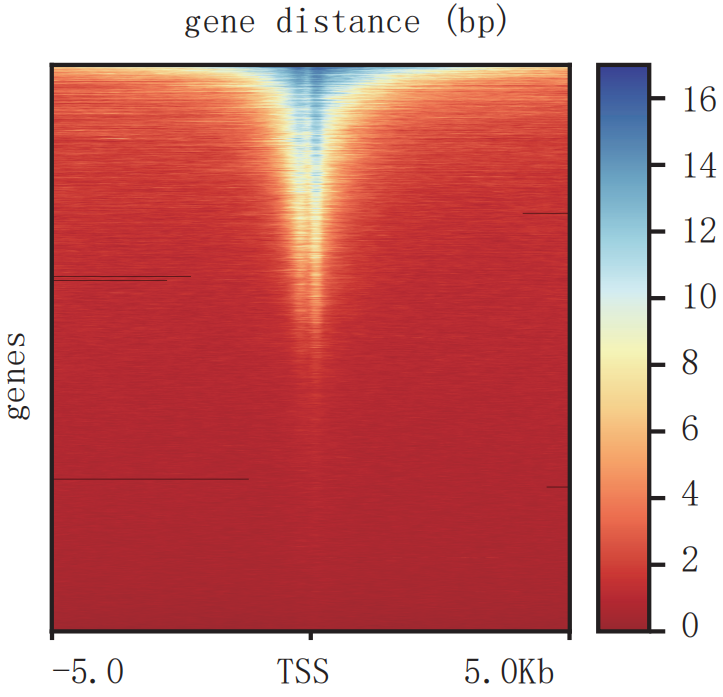
Heatmap of signal enrichment at TSS
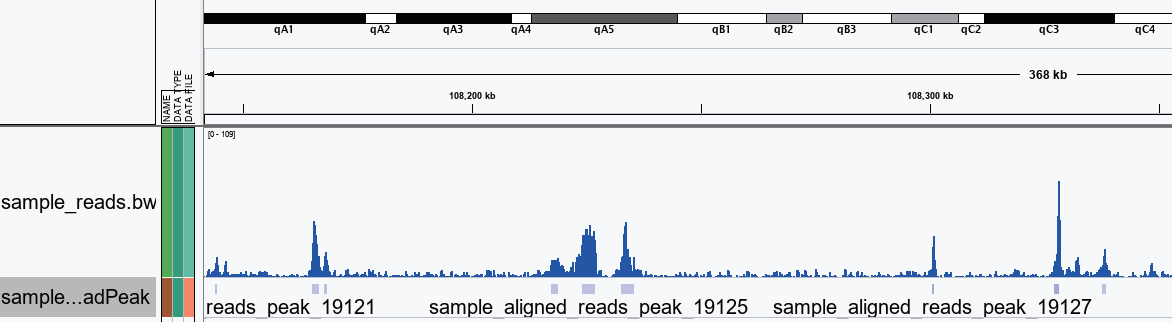
IGV Visualization of peak regions