
Whole Exome Sequencing
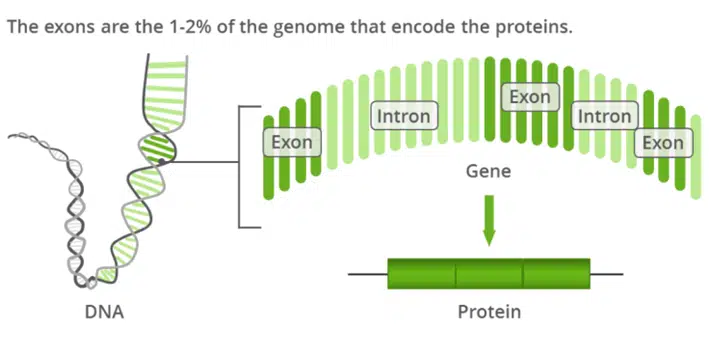
Figure 1. An example of a gene structure
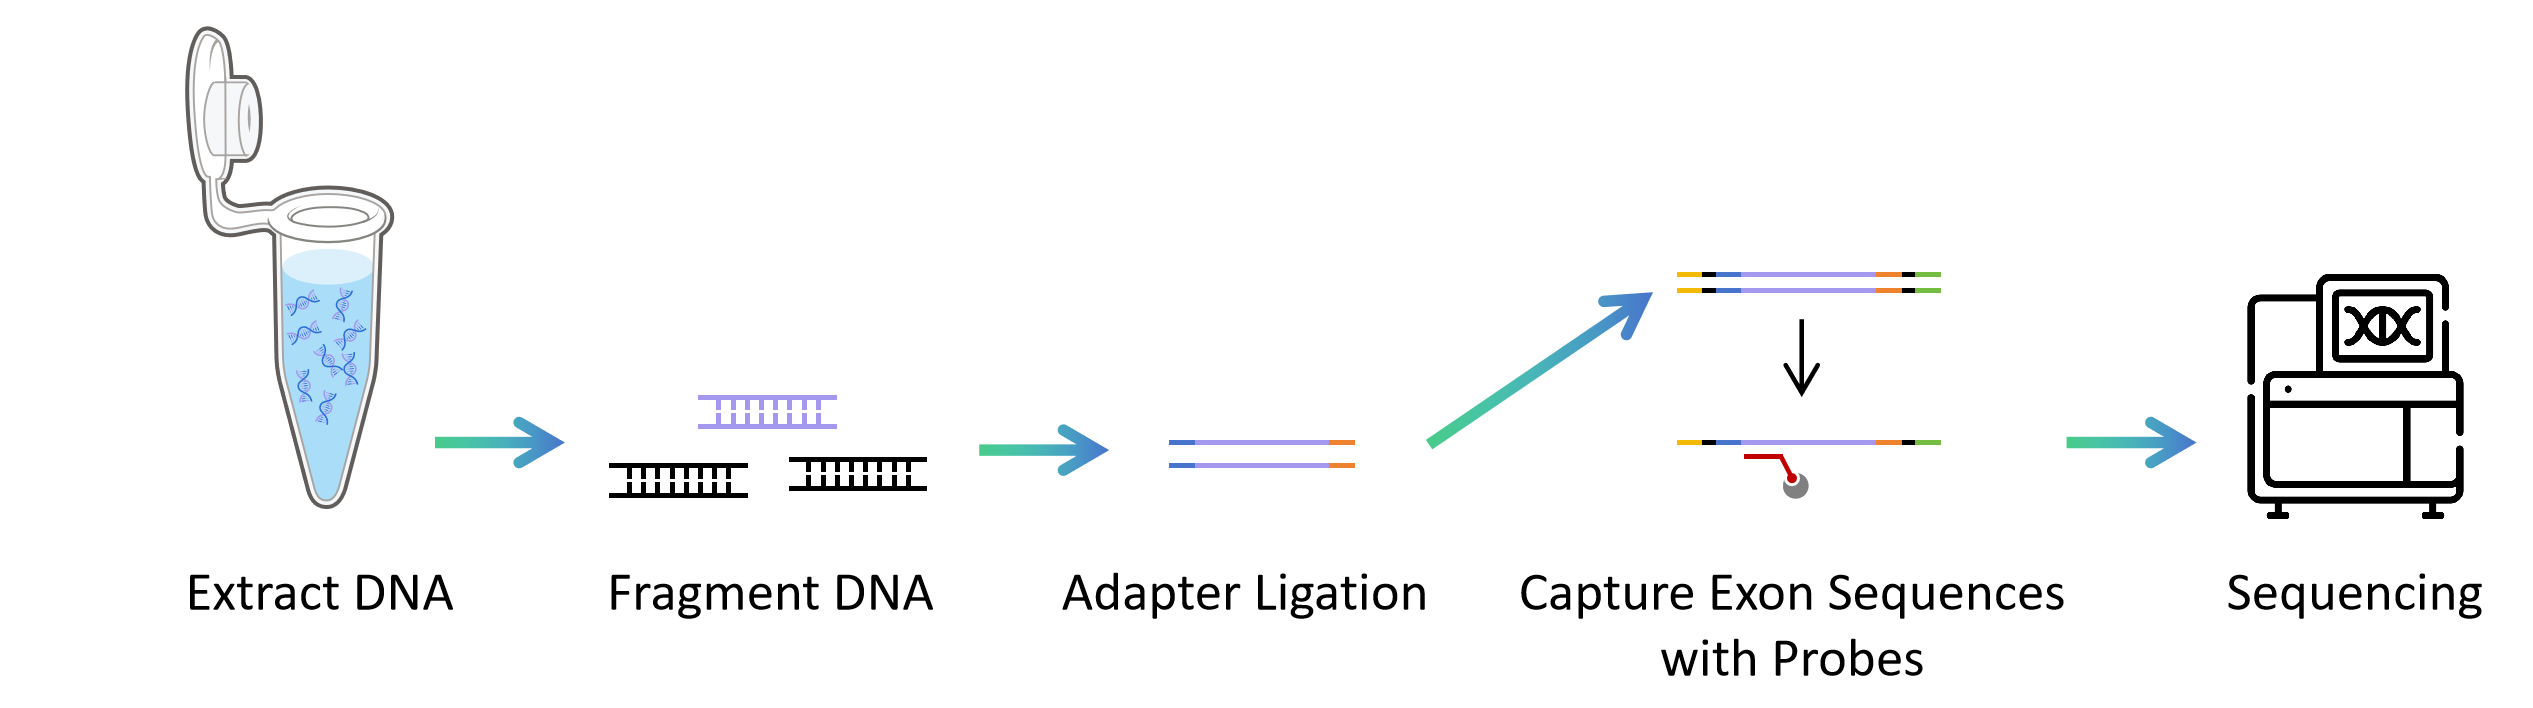
Figure 2. Workflow of WES
Bioinformatic Analysis
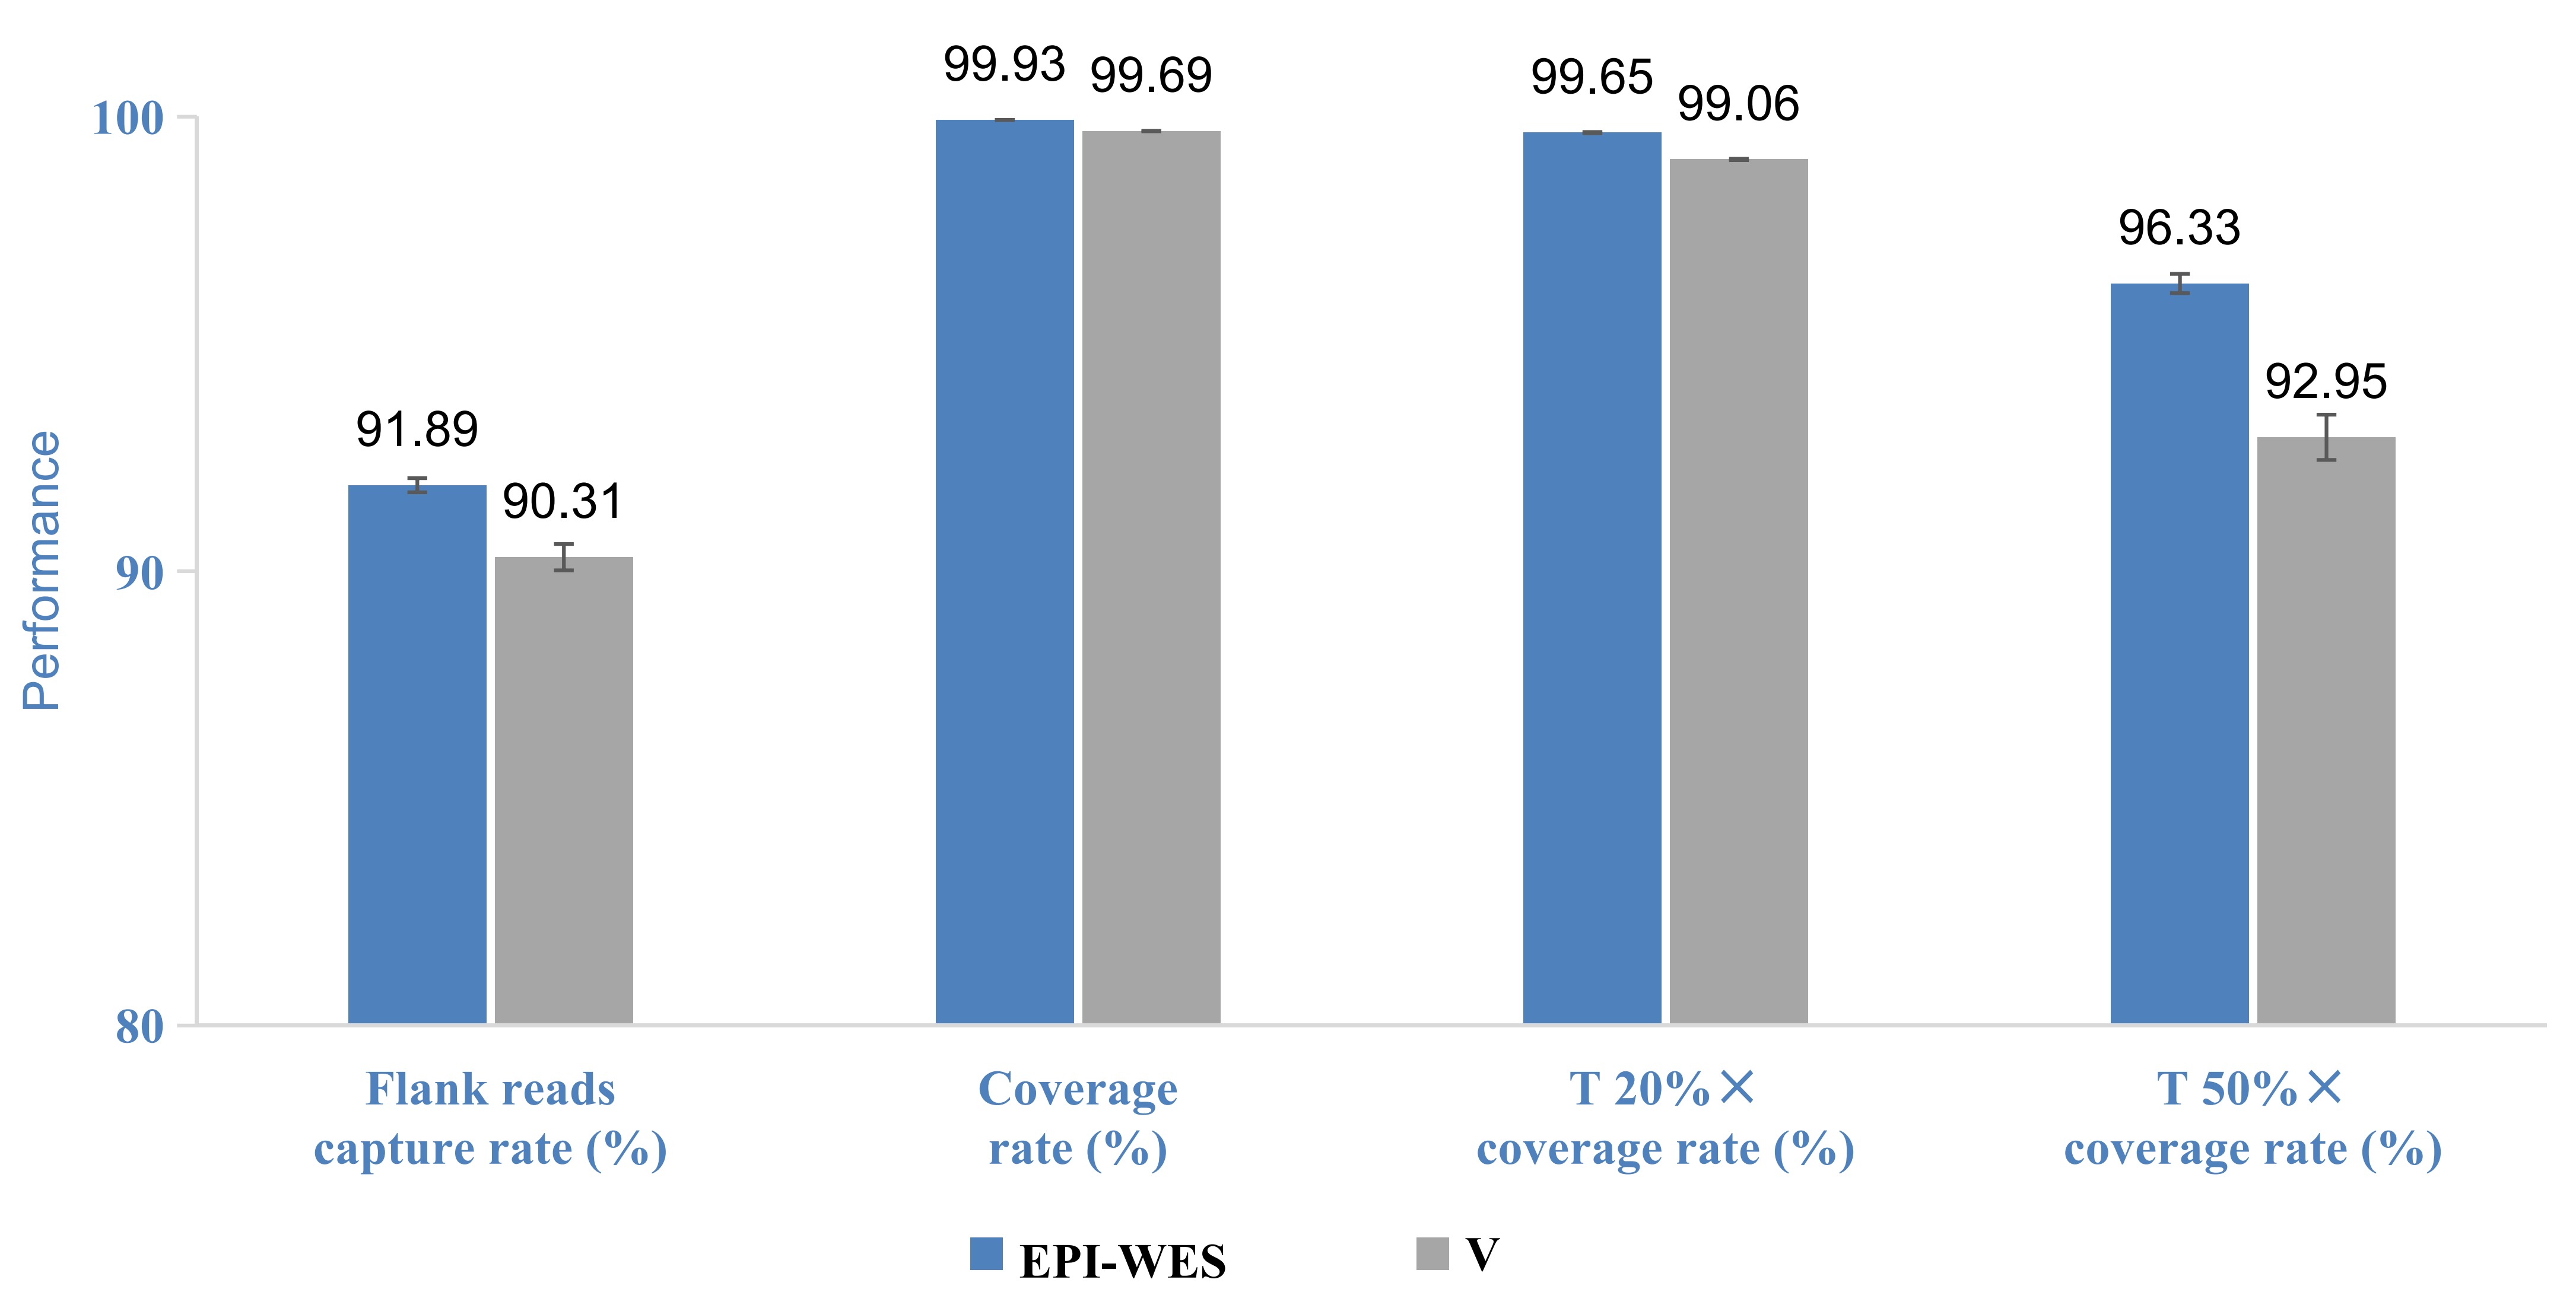
Figure 3. Actual performance of gDNA samples. Compared with other brands, the capture efficiency is higher and the uniformity is better
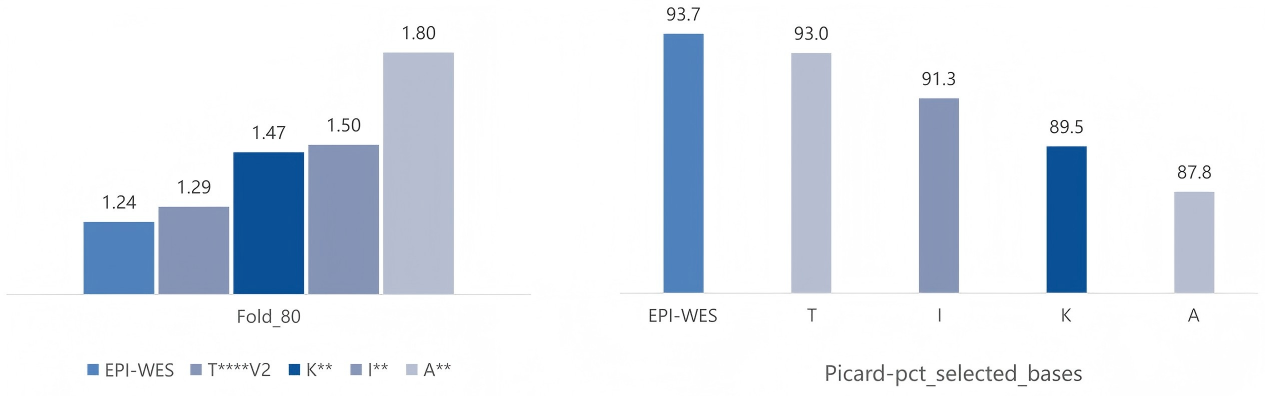
Figure 4. Left: Homogeneity index reached 1.24; right: The capture efficiency was higher than other brands, reaching 93.7%
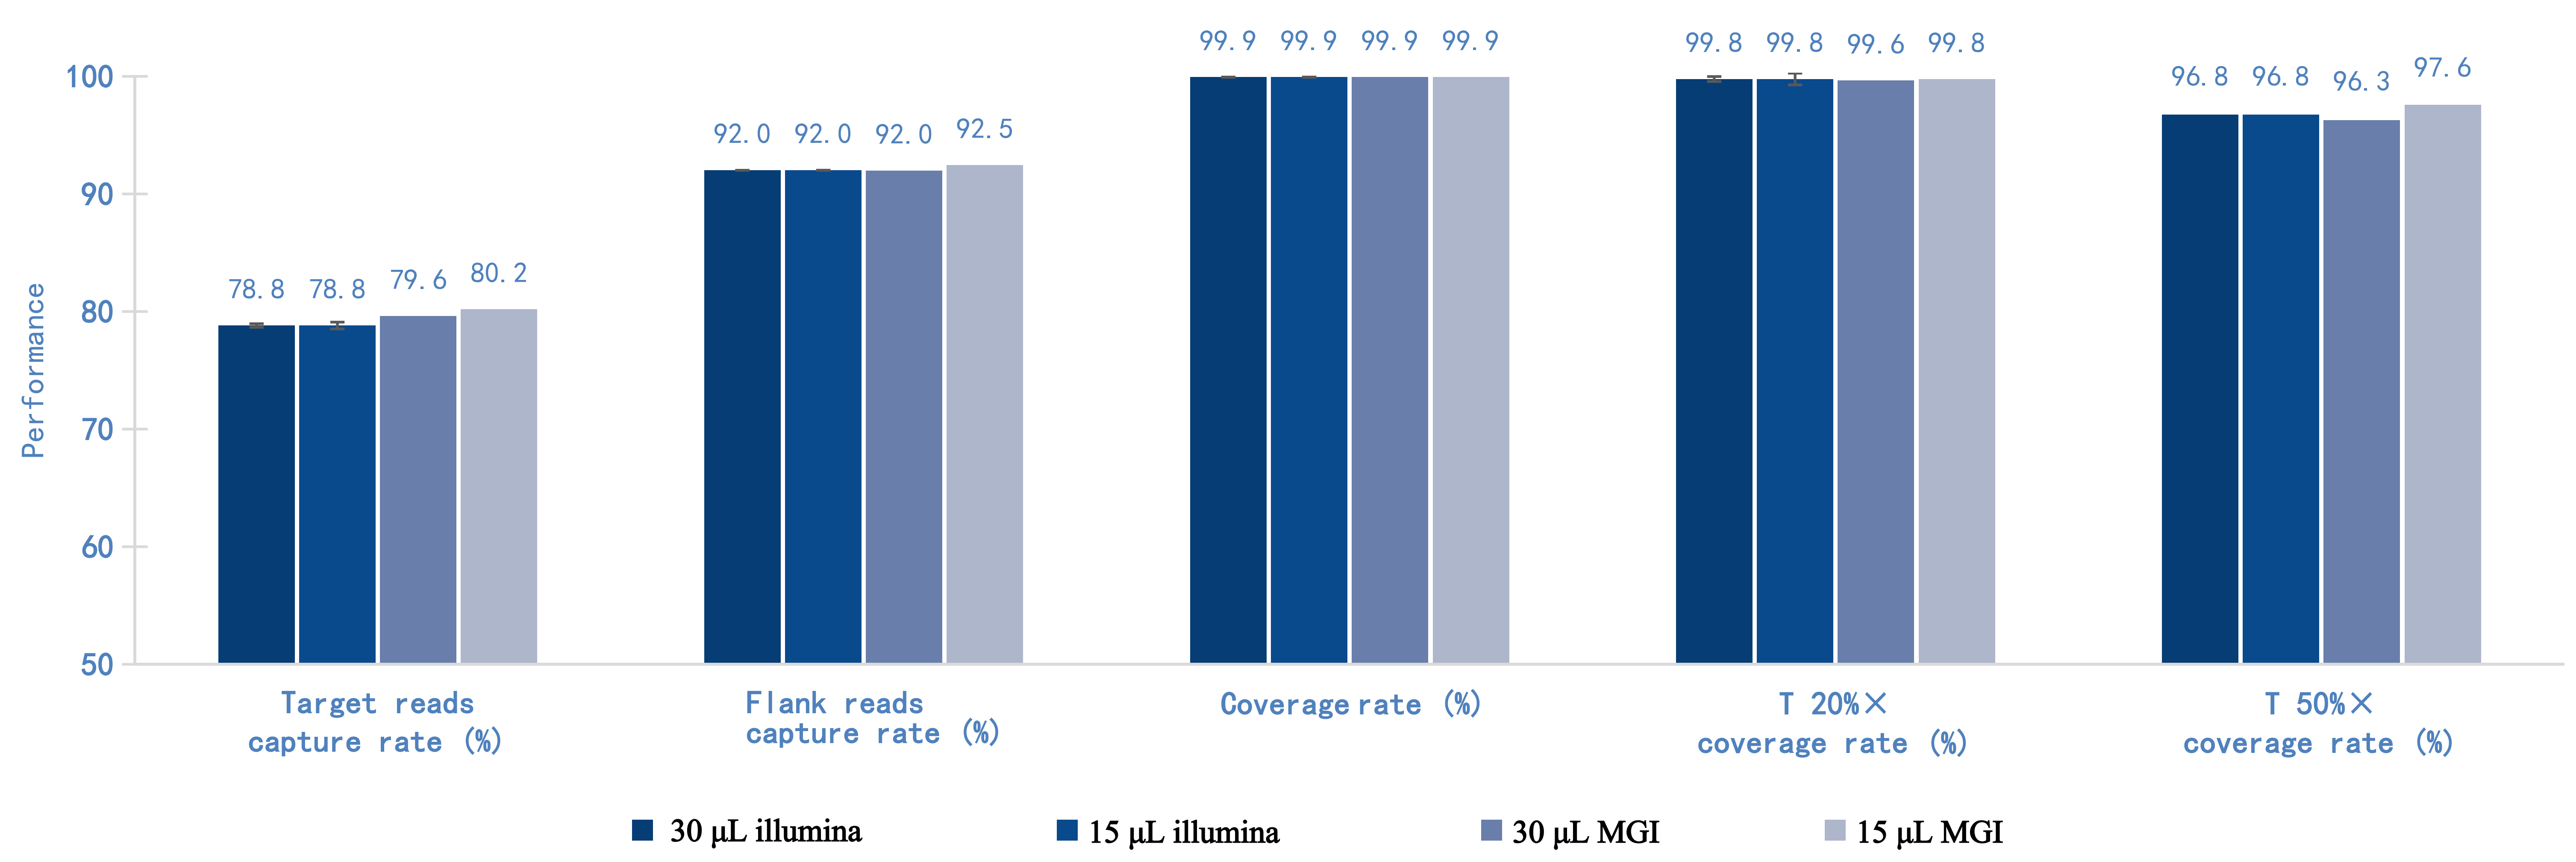
Figure 5. Performance metrics of the service using the kit across different sequencing platforms. Sequencing was performed on NovaSeq6000 and DNBSEQ-T7 (30 μL, 15 μL hybridization volume)
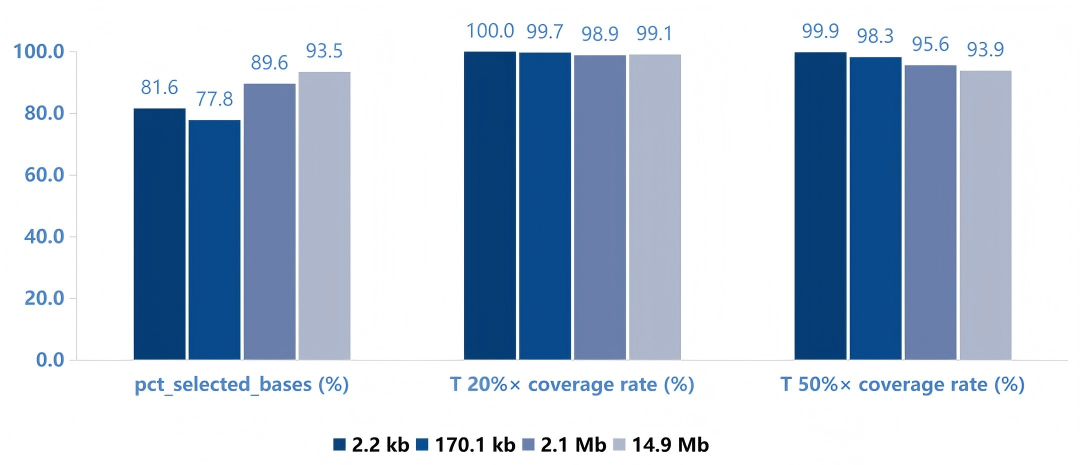
Figure 6. Data performance of the EPI-WES hybridization system in different Panel sizes. Libraries obtained with 750 ng input were captured using Illumina PE150 with different Panel sizes.
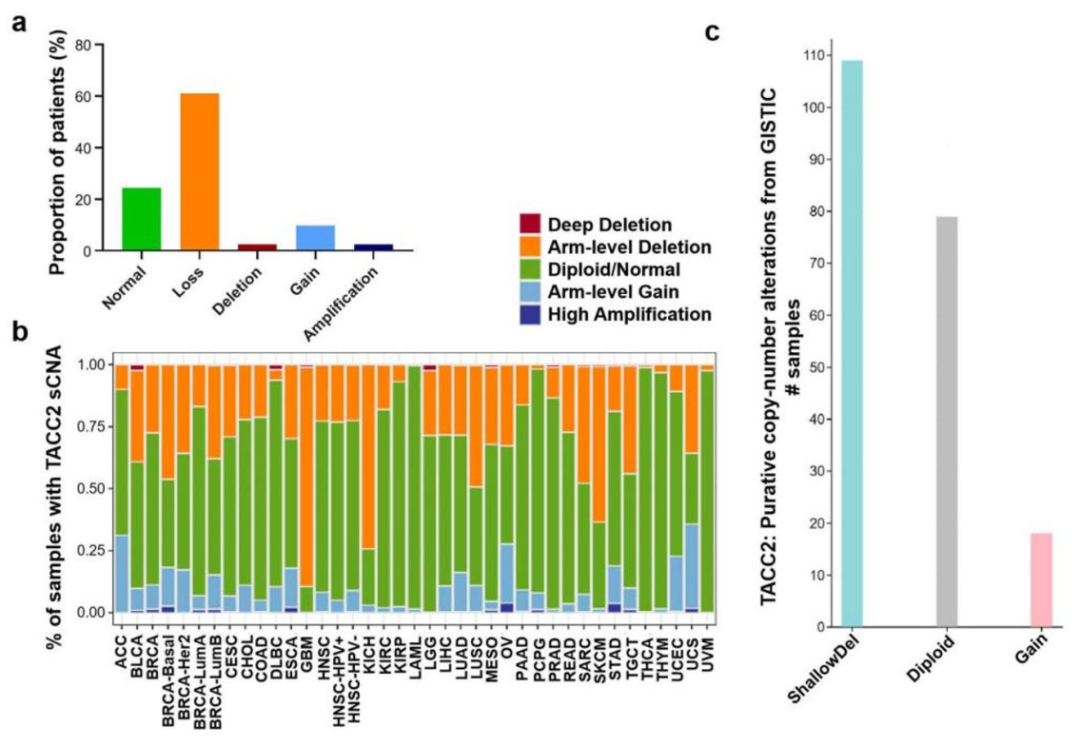
Figure 7. Analysis of TACC2 copy number variation
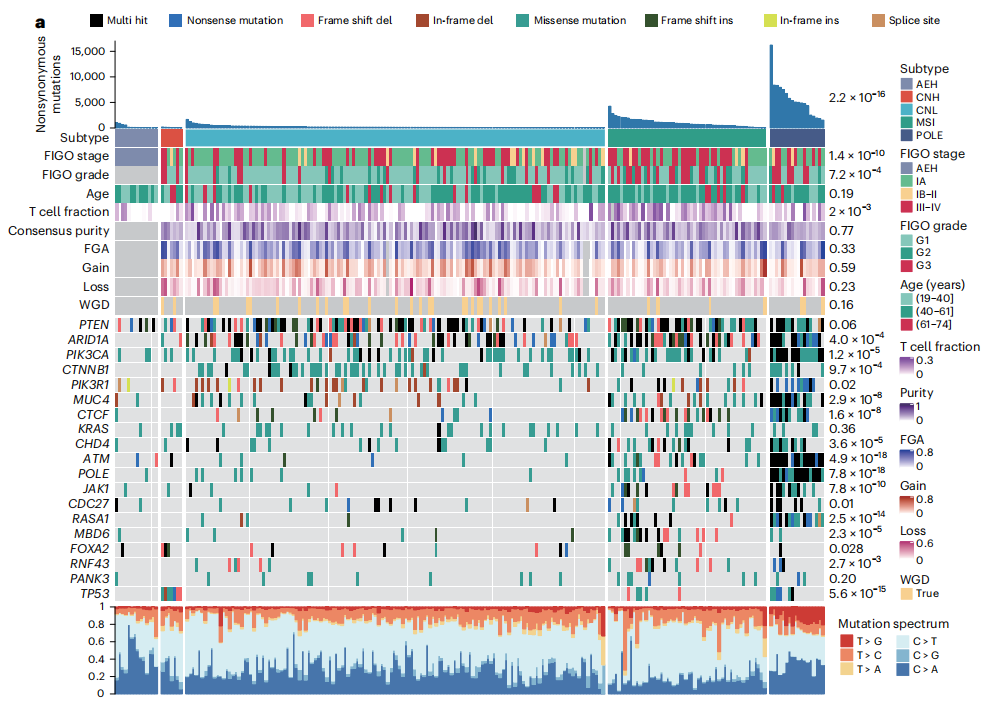
Figure 8. Genetic characteristics and related clinical and pathological characteristics of EEC patients in 229 TJFD studies