
CUT&Tag: A Technology for Protein-DNA Interaction Studies
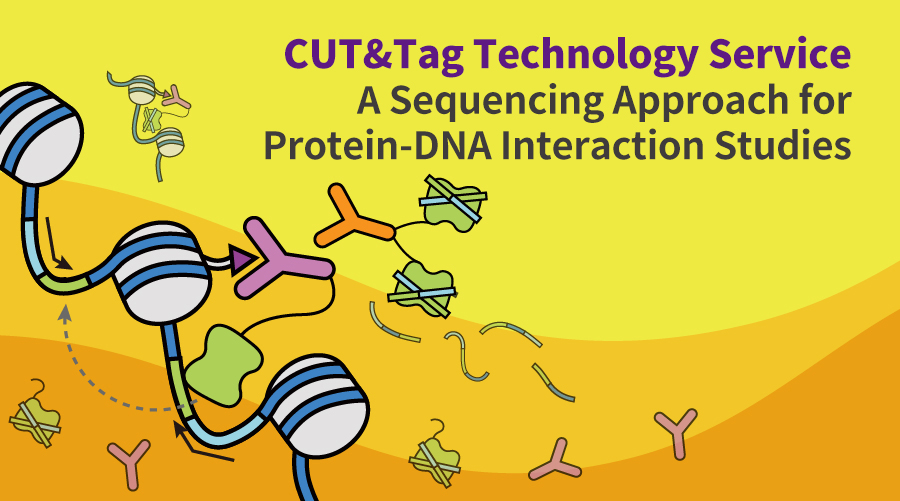
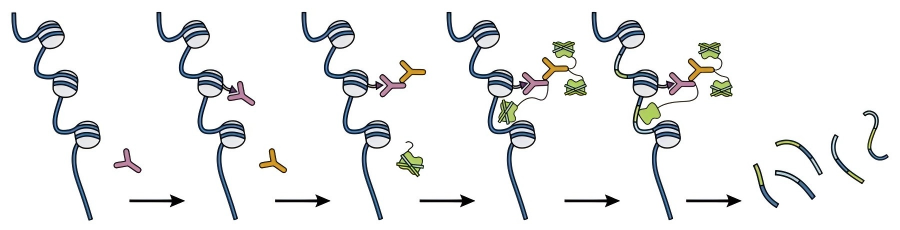
Figure 1. CUT&Tag Technical schematic
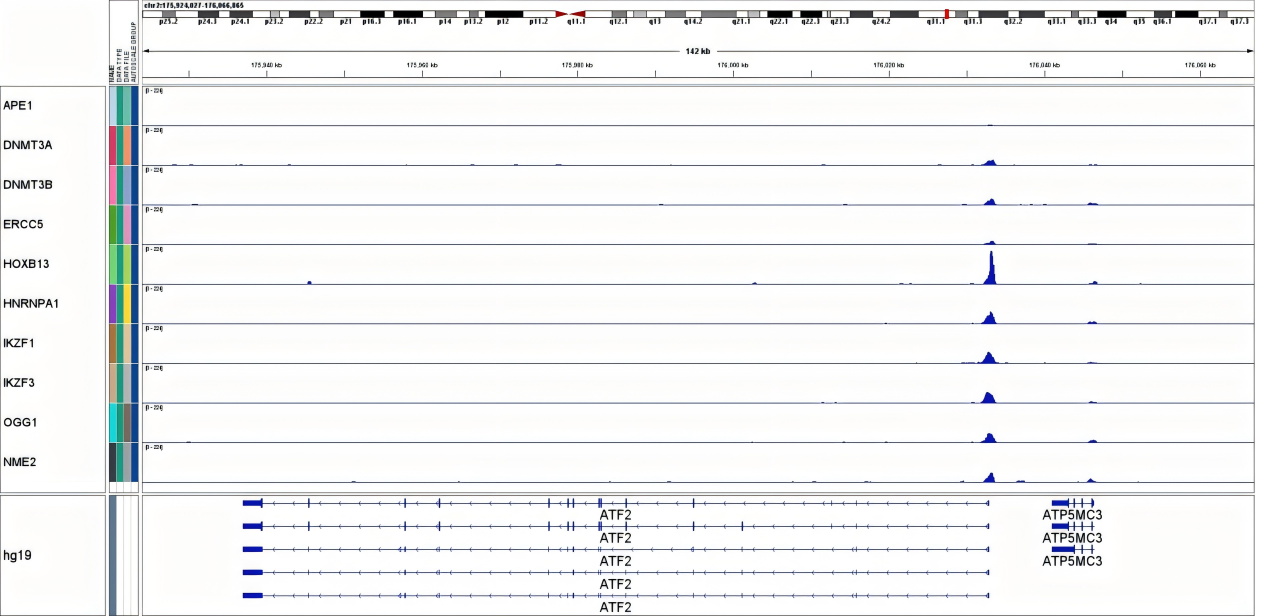
Figure 2. IGV peak plots
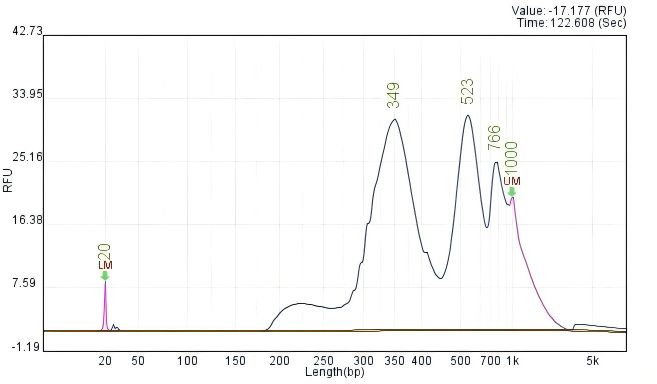
Figure 3. CUT&Tag QC
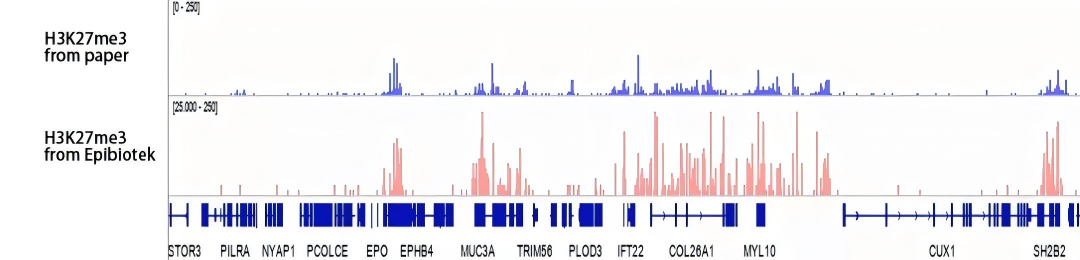
Figure 4. Epibiotek uses CUT&Tag to detect the read coverage map of histone modification H3K27me3, showing the CUT&Tag H3K27me3 peaks (second track) and comparing them with the literature data (first track)[1]
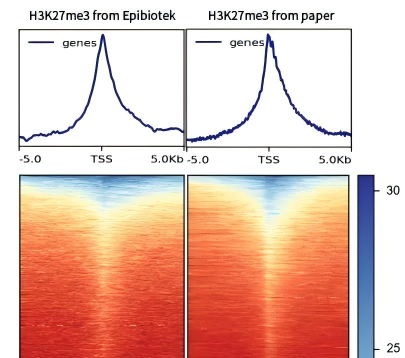
Figure 5. Epibiotek used CUT&Tag to detect the TSS distribution of H3K27me3 in the heat map (left column), and compared with the literature data (right column)[1]
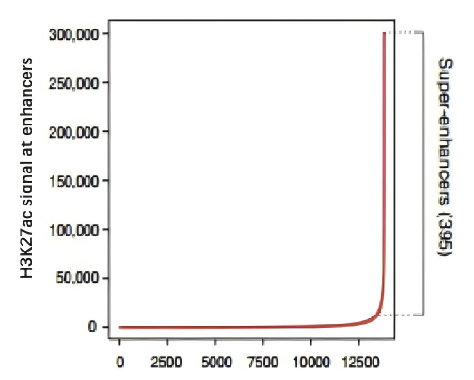
Figure 6. Identification and analysis of enhancer and super-enhancer
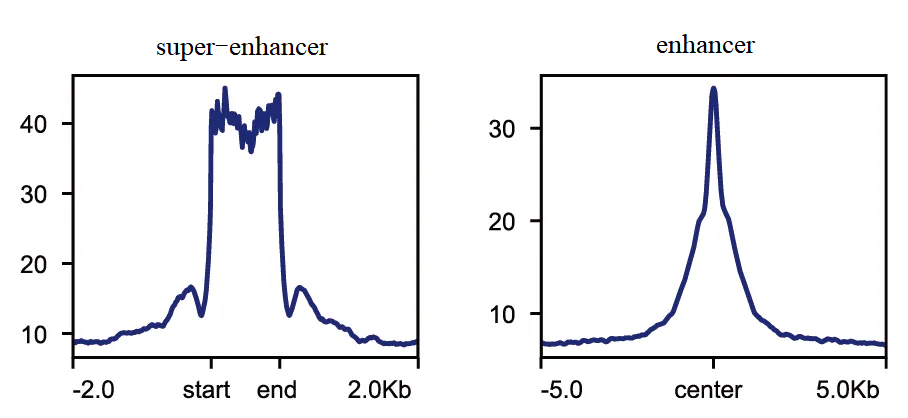
Figure 7. Signal enrichment map of enhancer and super-enhancer
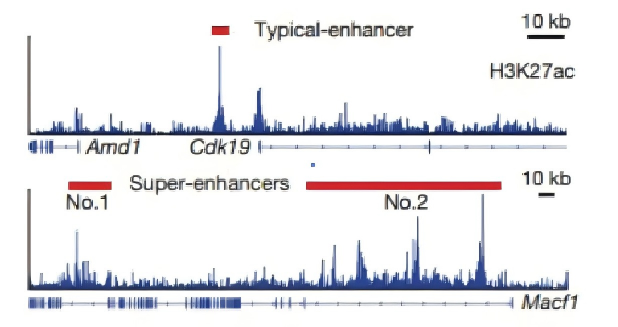
Figure 8. Figure of super-enhancer identification and quantity analysis
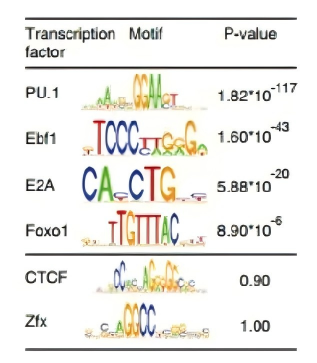
Figure 9. Prediction of super-enhancer binding transcription factors
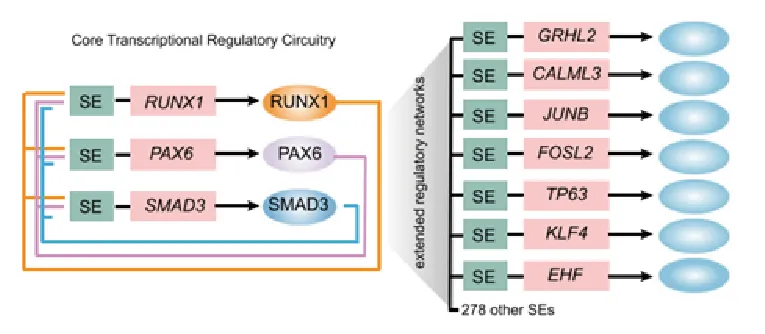
Figure 10. Core transcription factor regulatory circuit(CRC)
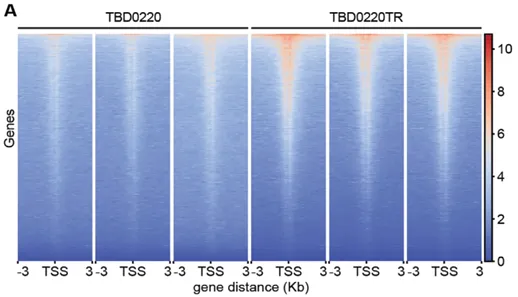
Figure 11. The heat map showed that H3K9la CUT&Tag sequencing signals were significantly enriched in TBD0220TR cells
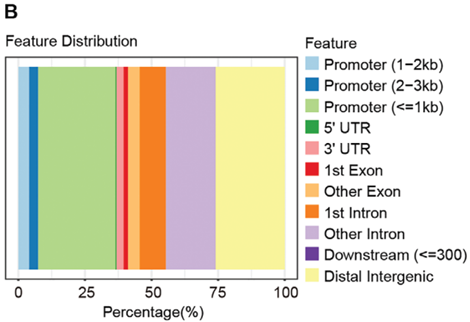
Figure 12. Most of the enriched peaks of H3K9la upregulated in TBD0220TR cells were located in the promoter region
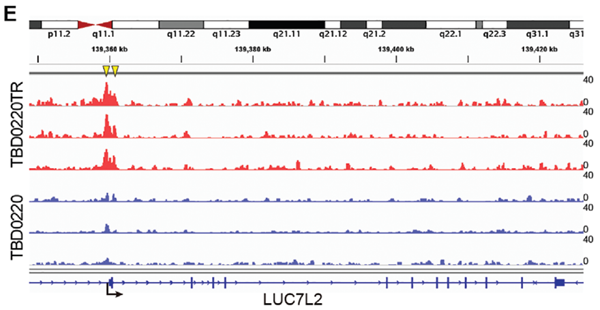
Figure 13. The IGV plot shows the H3K9la peak on the LUC7L2 promoter
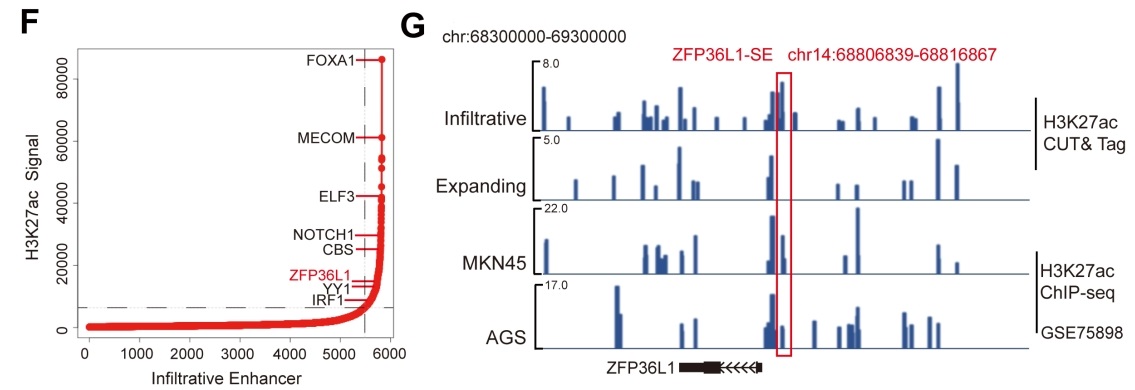
Figure 14. CUT&Tag identified the SE driving gene ZFP36L1